August 20, 2025 a 07:46 am
HIG: Dividend Analysis - The Hartford Financial Services Group, Inc.
The Hartford Financial Services Group has consistently delivered shareholder value with its stable dividend payments and prudent financial management. With a robust dividend history, impressive payout ratios, and stellar financial stability, it remains a strong contender for dividend-focused portfolios, especially given its steady growth and strategic cash flow management.
Overview
📊 The Hartford Financial Services Group offers investors a compelling dividend yield of 1.58%, with a current dividend per share set at 1.96 USD. With three decades of continuous dividend history, this company exhibits reliability in returns. Notably, there have been no recent dividend cuts or suspensions.| Parameter | Details |
|---|---|
| Sector | Financial Services |
| Dividend yield | 1.58% |
| Current dividend per share | 1.96 USD |
| Dividend history | 30 years |
| Last cut or suspension | None |
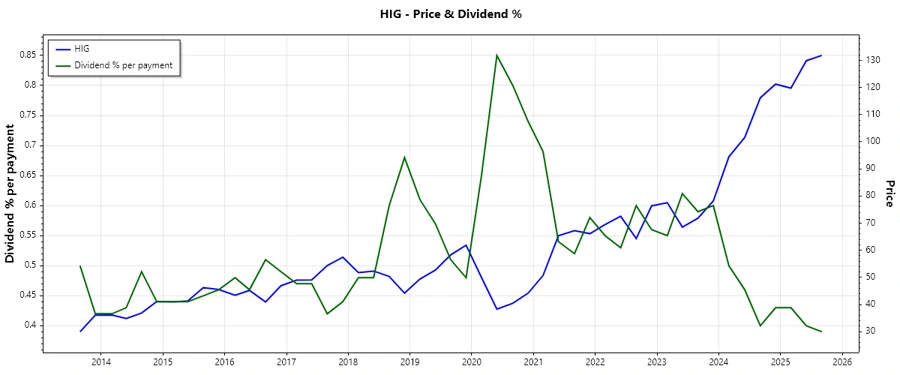
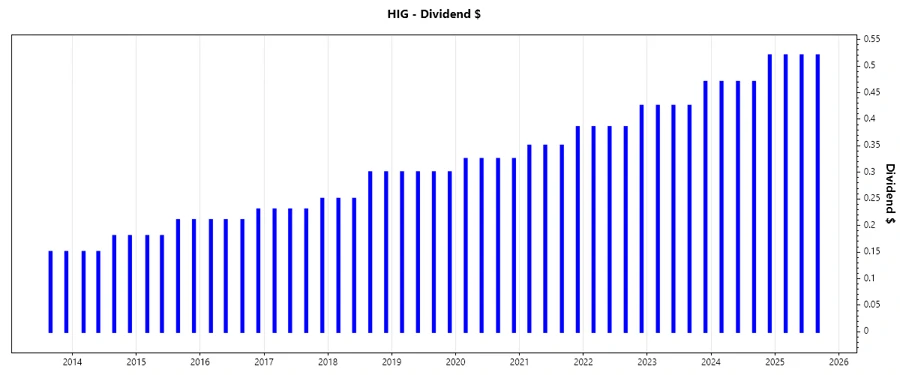
Dividend History
📈 The extended dividend history of The Hartford showcases its steadfastness in delivering shareholder returns. This historical consistency is a testament to the company's ability to manage cash flow and earnings efficiently, even during economic fluctuations.
| Year | Dividend Per Share (USD) |
|---|---|
| 2025 | 1.56 |
| 2024 | 1.93 |
| 2023 | 1.745 |
| 2022 | 1.58 |
| 2021 | 1.435 |
Dividend Growth
📉 The Hartford exhibits moderate growth in its dividends, reflecting strategic financial planning. Over the last five years, the average growth rate is approximately 9.97%, demonstrating consistent shareholder reward.| Time | Growth |
|---|---|
| 3 years | 10.38% |
| 5 years | 9.97% |
The average dividend growth is 9.97% over 5 years. This shows moderate but steady dividend growth.
Payout Ratio
🗣️ With a payout ratio of 17.16% based on earnings and 9.65% on free cash flow, The Hartford maintains a conservative dividend policy. These ratios underline the company's strategic approach to sustain dividends without over-leveraging its finances.| Key figure | Ratio |
|---|---|
| EPS-based | 17.16% |
| Free cash flow-based | 9.65% |
Such low payout ratios denote financial prudence, ensuring dividends are covered and allowing room for growth investments.
Cashflow & Capital Efficiency
📊 Strong cash flow metrics reveal The Hartford’s ability to generate and utilize cash effectively. A free cash flow yield of 15.42% alongside a high earnings yield reinforces its capital efficiency.| Metric | 2024 | 2023 | 2022 |
|---|---|---|---|
| Free Cash Flow Yield, Earnings Yield | 17.93% | 16.02% | 15.56% |
| CAPEX to Operating Cash Flow | 2.45% | 5.09% | 4.37% |
| Stock-based Compensation to Revenue | 0.06% | 0.00% | 0.60% |
| Free Cash Flow / Operating Cash Flow Ratio | 97.55% | 95.77% | 95.63% |
The thorough examination of cash flows shows robust management with exceptional free cash flow conversion rates indicating high capital efficiency.
Balance Sheet & Leverage Analysis
📈 The firm's strong balance sheet, seen through the meager debt-to-equity and debt-to-assets ratios, accentuates its financial resilience.| Metric | 2024 | 2023 | 2022 |
|---|---|---|---|
| Debt-to-Equity | 26.55% | 28.46% | 31.96% |
| Debt-to-Assets | 5.40% | 5.68% | 5.97% |
| Debt-to-Capital | 20.98% | 22.15% | 24.22% |
| Net Debt to EBITDA | 0.99 | 1.18 | 1.43 |
| Current Ratio, Quick Ratio | 17.18 | 0.69 | 24.79 |
| Financial Leverage | 4.92 | 5.01 | 5.36 |
These figures indicate The Hartford's prudent usage of leverage, maintaining liquidity and financial integrity.
Fundamental Strength & Profitability
✅ The Hartford's profitability metrics showcase notable returns, with ROE beating normative thresholds significantly.| Metric | 2024 | 2023 | 2022 |
|---|---|---|---|
| Return on Equity | 18.92% | 16.34% | 13.34% |
| Return on Assets | 3.84% | 3.26% | 2.49% |
| Margins: Net, EBIT, EBITDA, Gross | 11.79%, 14.59%, 15.95%, 15.05% | 10.29%, 12.69%, 14.79%, 13.02% | 8.32%, 10.35%, 13.21%, 9.39% |
| Research & Development to Revenue | 0.00% | 0.00% | 0.00% |
Prominent profitability metrics suggest effective use of equity and assets to generate income, reflecting intrinsic business strength.
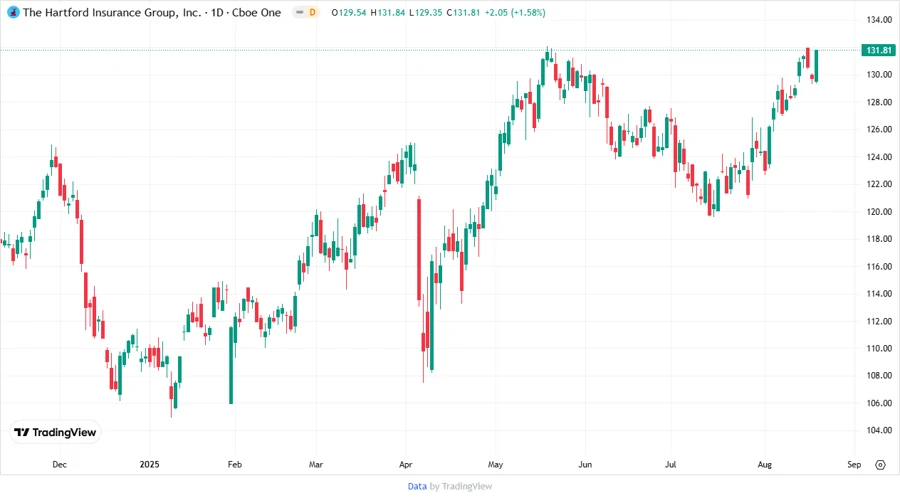
Price Development
Dividend Scoring System
🗣️ The Hartford's dividends are rated based on multiple parameters, providing a comprehensive view of its dividend strength.| Category | Score | Rating |
|---|---|---|
| Dividend yield | 3 | |
| Dividend Stability | 5 | |
| Dividend growth | 4 | |
| Payout ratio | 5 | |
| Financial stability | 5 | |
| Dividend continuity | 5 | |
| Cashflow Coverage | 5 | |
| Balance Sheet Quality | 5 |
Total Score: 37/40
Rating
⚠️ The Hartford Financial Services Group is a strong dividend stock, offering regular income and financial security to investors. Its superior dividend policies, coupled with solid financials and a commendable market position, allow it to maintain and grow dividends over time. It is ideal for investors seeking a blend of reliability and growth in their portfolio.
Smart Data Insight
Master the Perfect Entry & Exit for this Stock
Don't leave your profits to chance. Historically, this stock follows specific seasonal patterns that institutional traders use to maximize returns.
- ✅ Identify the "Golden Buying Window"
- ✅ Avoid high-risk correction cycles
- ✅ Backtested data from the last 20+ years