November 04, 2025 a 03:15 am
HBAN: Trend and Support & Resistance Analysis - Huntington Bancshares Incorporated
Huntington Bancshares Incorporated operates as a bank holding company, providing a range of banking services. Based on recent price movements and trends, the stock appears to be ...
Trend Analysis
| Date | Close Price | Trend |
|---|---|---|
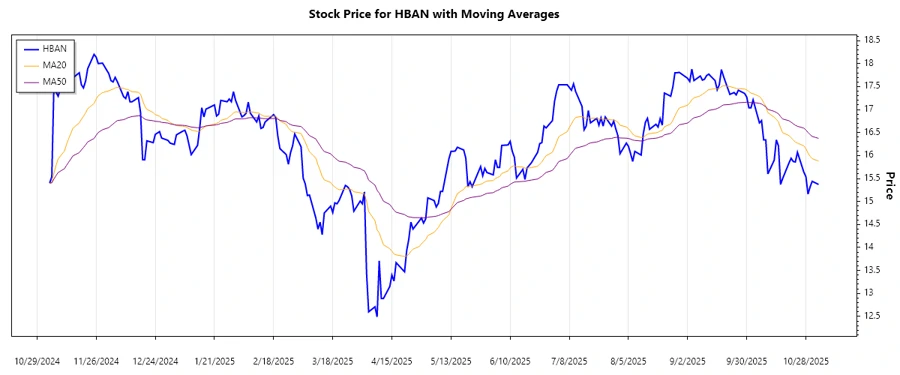
| 2025-11-03 | $15.37 | ▼ |
| 2025-10-31 | $15.44 | ▼ |
| 2025-10-30 | $15.32 | ▼ |
| 2025-10-29 | $15.16 | ▼ |
| 2025-10-28 | $15.54 | ▼ |
| 2025-10-27 | $15.64 | ▼ |
| 2025-10-24 | $16.07 | ▼ |
Based on the calculated EMAs, the stock is in a downward trend as the EMA20 is below the EMA50.
Support and Resistance
| Zone Type | From | To |
|---|---|---|
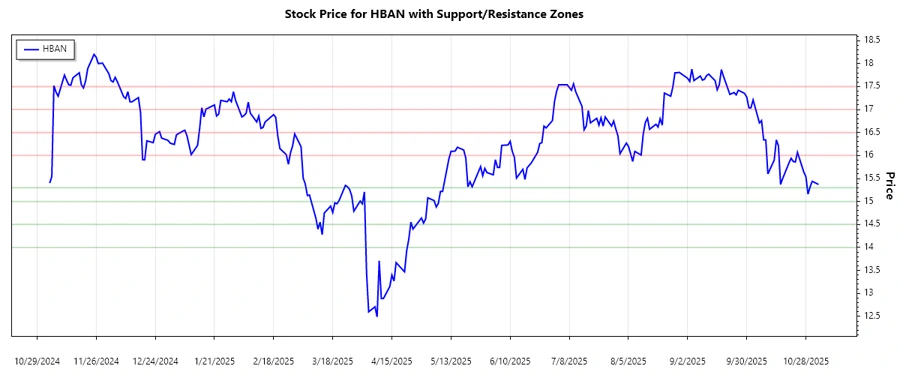
| Support Zone 1 | $14.00 | $14.50 |
| Support Zone 2 | $15.00 | $15.30 |
| Resistance Zone 1 | $16.00 | $16.50 |
| Resistance Zone 2 | $17.00 | $17.50 |
The current price of $15.37 is close to the first support zone, indicating potential price stabilization.
Conclusion
Huntington Bancshares Incorporated currently shows a downward trend, with the EMA20 below the EMA50. Key support zones are nearing where price stabilization may occur, offering potential buying opportunities. However, the presence of resistance levels could challenge any upward movement in the short term. Investors should be cautious and monitor the price action closely to adapt to any market changes quickly. Analysts should note the current financial conditions and external market influences that might impact the stock further.
Smart Data Insight
Master the Perfect Entry & Exit for this Stock
Don't leave your profits to chance. Historically, this stock follows specific seasonal patterns that institutional traders use to maximize returns.
- ✅ Identify the "Golden Buying Window"
- ✅ Avoid high-risk correction cycles
- ✅ Backtested data from the last 20+ years