April 10, 2026 a 12:46 pm


HBAN: Dividend Analysis - Huntington Bancshares Incorporated
Huntington Bancshares Incorporated presents an intriguing investment profile at its current state. With a resilience standing on over four decades of uninterrupted dividends and a yield that hovers just above 4%, it signals a stable income stream for investors. Its modest growth over five years might seem limited, yet it reflects a commitment to sustaining cash distribution. The firm exhibits moderate earnings allocations towards dividends reflected in the payout ratios, indicating a conservative approach appealing to risk-averse portfolios.
Overview 📊
The financial metrics of Huntington Bancshares delineate a conservative yet stable approach to dividend management. The company's sector, financial services, typically signals robust cash flow essential for consistent dividend payouts.
| Measure | Value |
|---|---|
| Sector | Financial Services |
| Dividend Yield | 4.10% |
| Current Dividend per Share | 0.69 USD |
| Dividend History | 43 years |
| Last Cut/Suspension | None |
Dividend History 📈
With over 43 years of uninterrupted dividends, Huntington Bancshares has built a reputation of reliability. Such a history provides confidence in their ability to return capital to shareholders even in uncertain times. The visual depiction below underscores a reliable history with sustained payouts except for a brief halt in the past.
| Year | Dividend per Share (USD) |
|---|---|
| 2026 | 0.155 |
| 2025 | 0.620 |
| 2024 | 0.620 |
| 2023 | 0.620 |
| 2022 | 0.620 |
Dividend Growth 🗣️
Despite the recent trajectory showing limited growth over three and five years, the commitment to maintaining the dividend highlights long-term stability. The absence of growth in the near past calls for vigilance from potential investors aiming for capital growth via income increases.
| Time | Growth |
|---|---|
| 3 years | 0% |
| 5 years | 0.66% |
The average dividend growth is 0.66% over 5 years. This shows moderate but steady dividend growth.
Payout Ratio 🏦
Payout ratios elucidate how much profit is returned as dividends. Huntington's EPS-based ratio is 47.97%, demonstrating a balanced approach to dividend disbursement, leaving ample room for reinvestment in the business. The FCF-based ratio at 44.85% suggests cash flows are efficiently covering dividends, indicating a robust payout strategy.
| Key figure ratio | Percentage |
|---|---|
| EPS-based | 47.97% |
| Free cash flow-based | 44.85% |
Cashflow & Capital Efficiency 💰
Evaluating cash flows enlightens us on the fiscal health and reinvestment capacity of a firm. Huntington exhibits a respectable free cash flow yield of 9.23%, signaling efficient capital deployment.
| Measure | 2025 | 2024 | 2023 |
|---|---|---|---|
| Free Cash Flow Yield | 8.88% | 7.08% | 13.68% |
| Earnings Yield | 8.62% | 8.21% | 10.60% |
| CAPEX to Operating Cash Flow | 10.49% | 7.88% | 5.27% |
| Stock-based Compensation to Revenue | 0.91% | 0.89% | 0.90% |
| Free Cash Flow / Operating Cash Flow Ratio | 89.51% | 92.12% | 94.73% |
Huntington's free cash flow metrics suggest a solid footing for capital efficiency, supporting both operational needs and shareholder returns.
Balance Sheet & Leverage Analysis 📉
Analyzing the company's leverage and financial stability paints a picture of risk management. With a debt-to-equity ratio of 0.76, Huntington Bancshares positions itself conservatively, thus maintaining a structured financial framework.
| Measure | 2025 | 2024 | 2023 |
|---|---|---|---|
| Debt-to-Equity | 0.759 | 0.840 | 0.672 |
| Debt-to-Assets | 0.082 | 0.081 | 0.069 |
| Debt-to-Capital | 0.432 | 0.456 | 0.402 |
| Net Debt to EBITDA | 5.41 | 1.07 | 0.85 |
| Current Ratio | 0.189 | 0.153 | 0.135 |
| Quick Ratio | 0.190 | 0.153 | 0.135 |
| Financial Leverage | 9.25 | 10.35 | 9.78 |
Such deliberative leverage management contributes to financial solidity, aiding in persistent dividend payouts even amidst fluctuating economic conditions.
Fundamental Strength & Profitability ✅
The depth of a company's profitability ratios gives an indication of its operational efficiency and market competitiveness. Return on equity and asset margins portray potential return benefits for shareholders.
| Measure | 2025 | 2024 | 2023 |
|---|---|---|---|
| Return on Equity | 9.08% | 9.83% | 10.08% |
| Return on Assets | 0.98% | 0.95% | 1.03% |
| Margins: Net | 17.71% | 16.22% | 18.10% |
| Margins: EBIT | 21.53% | 20.09% | 22.11% |
| Margins: EBITDA | 21.53% | 25.29% | 29.52% |
| Margins: Gross | 61.70% | 58.23% | 64.02% |
| Research & Development to Revenue | 0% | 0% | 0% |
High return ratios substantiate that Huntington is adept at converting equity and assets into profit, a positive indicator for prospective shareholders.
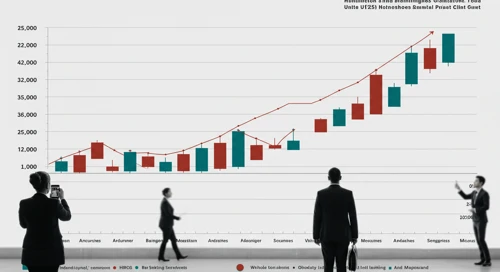
Price Development 📈
Dividend Scoring System 🌟
| Criteria | Rating (1-5) | Score Bar |
|---|---|---|
| Dividend Yield | 4 | |
| Dividend Stability | 5 | |
| Dividend Growth | 2 | |
| Payout Ratio | 3 | |
| Financial Stability | 4 | |
| Dividend Continuity | 5 | |
| Cashflow Coverage | 4 | |
| Balance Sheet Quality | 3 |
Total Score: 30/40
Rating 🛡️
In conclusion, Huntington Bancshares Incorporated stands as a meritorable selection for income-focused investors. While the dividend growth is limited, its stably high yield, diligent payout strategy, and strong financial architecture offer substance for a steady income stream. Prospective investors looking for stability over growth should consider HBAN as a potent addition to their portfolio.
Smart Data Insight
Master the Perfect Entry & Exit for this Stock
Don't leave your profits to chance. Historically, this stock follows specific seasonal patterns that institutional traders use to maximize returns.
- ✅ Identify the "Golden Buying Window"
- ✅ Avoid high-risk correction cycles
- ✅ Backtested data from the last 20+ years