March 21, 2026 a 12:46 pm
HBAN: Dividend Analysis - Huntington Bancshares Incorporated
Huntington Bancshares Incorporated demonstrates consistent dividend payments over the years with a current dividend yield of 4.10%. While the dividend growth is minimal, the company's solid 43-year history of dividend payments showcases a strong commitment to shareholders. However, investors should be cautious about the stability of this yield given the economic backdrop and market dynamics.
📊 Overview
The overview provides a snapshot of Huntington Bancshares' dividend profile and its broader context within the market.
| Metric | Value |
|---|---|
| Sector | Financial Services |
| Dividend yield | 4.10 % |
| Current dividend per share | 0.69 USD |
| Dividend history | 43 years |
| Last cut or suspension | None |
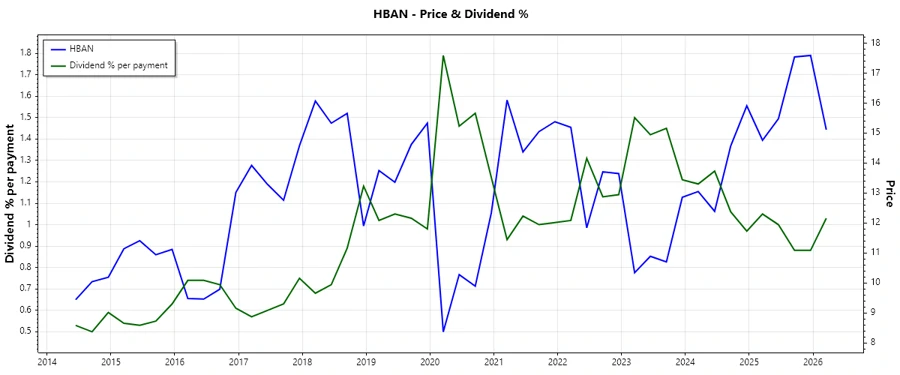
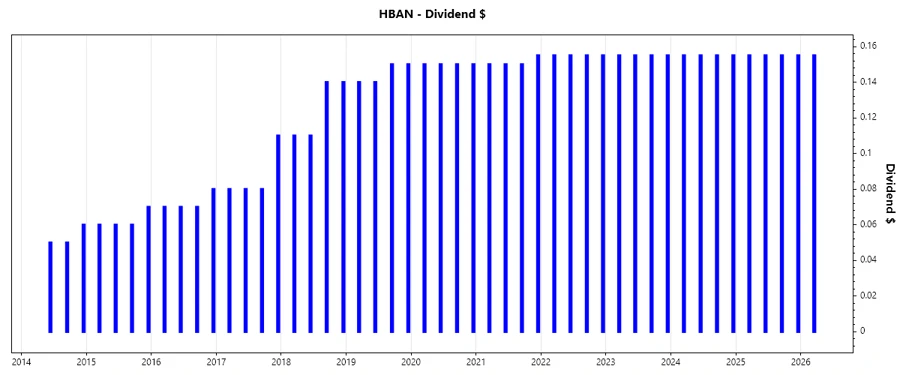
🗣️ Dividend History
A consistent dividend history is indicative of a company's commitment to rewarding shareholders. The following image and table illustrate Huntington Bancshares' recent dividend payouts, which is crucial for assessing reliability and performance over time.
| Year | Dividend per Share (USD) |
|---|---|
| 2026 | 0.155 |
| 2025 | 0.620 |
| 2024 | 0.620 |
| 2023 | 0.620 |
| 2022 | 0.620 |
📈 Dividend Growth
Dividend growth is a key indicator of a company’s ability to increase shareholder value over time. An evaluation of growth over 3 and 5 years underscores the company's profitability growth.
| Time | Growth |
|---|---|
| 3 years | 0 % |
| 5 years | 0.66 % |
The average dividend growth is 0.66% over 5 years. This shows moderate but steady dividend growth.
✅ Payout Ratio
The payout ratio analysis provides insights into a company’s ability to sustain or grow its dividends. Examining both EPS-based and Free Cash Flow-based ratios offers a comprehensive view of financial stability and shareholder returns.
| Key figure | Ratio |
|---|---|
| EPS-based | 47.97 % |
| Free cash flow-based | 44.85 % |
The payout ratios suggest the company maintains a healthy balance between rewarding shareholders and reinvesting for growth, particularly with a 47.97% EPS-based ratio.
📉 Cashflow & Capital Efficiency
Analyzing cash flow and capital efficiency helps assess financial health and operational effectiveness. These metrics determine the sustainability of dividends and capital projects.
| Year | 2025 | 2024 | 2023 |
|---|---|---|---|
| Free Cash Flow Yield | 8.88% | 7.08% | 13.68% |
| Earnings Yield | 8.62% | 8.22% | 10.60% |
| CAPEX to Operating Cash Flow | 10.49% | 7.88% | 5.27% |
| Stock-based Compensation to Revenue | 0.91% | 0.89% | 0.90% |
| Free Cash Flow / Operating Cash Flow Ratio | 89.51% | 92.12% | 94.73% |
Huntington Bancshares demonstrates a stable cash flow with a consistent free cash flow yield, suggesting efficiency in capital usage, however, improvements can be made on the operating cash flow leverage.
🗣️ Balance Sheet & Leverage Analysis
A thorough analysis of balance sheet strength and leverage is crucial for understanding long-term stability and risk. This section assesses debt levels and liquidity.
| Year | 2025 | 2024 | 2023 |
|---|---|---|---|
| Debt-to-Equity | 75.93% | 83.96% | 67.25% |
| Debt-to-Assets | 8.21% | 8.11% | 6.87% |
| Debt-to-Capital | 43.16% | 45.64% | 40.21% |
| Net Debt to EBITDA | 6.21 | 1.07 | 0.85 |
| Current Ratio | 0.19 | 0.15 | 0.14 |
| Quick Ratio | 0.19 | 0.15 | 0.13 |
| Financial Leverage | 9.25 | 10.35 | 9.78 |
The company's leverage ratios and quick ratio indicate a high level of financial risk, highlighting a potential area for improvement to bolster financial stability.
📊 Fundamental Strength & Profitability
Assessing fundamental strength and profitability provides insights into operational performance and the potential for future growth, which is crucial for long-term investors.
| Year | 2025 | 2024 | 2023 |
|---|---|---|---|
| Return on Equity | 9.08% | 9.83% | 10.08% |
| Return on Assets | 0.98% | 0.95% | 1.03% |
| Margins: Net | 17.71% | 16.22% | 18.10% |
| Margins: EBITDA | 21.53% | 25.29% | 29.52% |
| Margins: Gross | 61.70% | 58.23% | 64.02% |
| Research & Development to Revenue | 0.00% | 0.00% | 0.00% |
The profitability metrics and operating margins show the company maintains strong operational efficiency, though there is room to enhance return metrics in the competitive landscape.
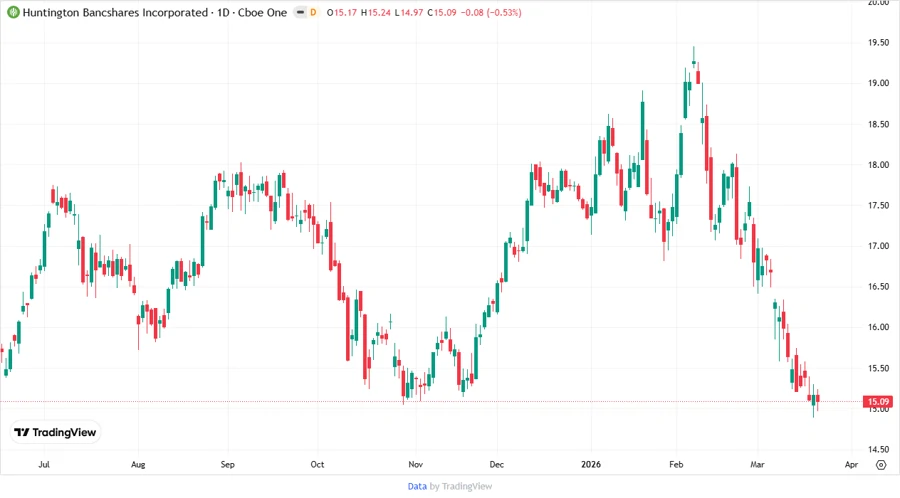
📉 Price Development
✅ Dividend Scoring System
| Criteria | Score | |
|---|---|---|
| Dividend yield | 3 | |
| Dividend Stability | 4 | |
| Dividend growth | 2 | |
| Payout ratio | 4 | |
| Financial stability | 3 | |
| Dividend continuity | 5 | |
| Cashflow Coverage | 3 | |
| Balance Sheet Quality | 2 |
Overall Score: 26/40
Rating
Huntington Bancshares Incorporated maintains a solid dividend track record with a robust history of payouts. However, careful attention should be paid to the leverage level and modest growth in dividends. Investors might consider it a reliable, albeit somewhat stable, option for income investors seeking moderate yield stability over aggressive growth.