
July 21, 2026 a 03:15 am
HAS: Trend and Support & Resistance Analysis - Hasbro, Inc.
The stock of Hasbro, Inc. has shown a volatile pattern in recent months, influenced by market dynamics and the company's diverse product line. Given its robust brand portfolio and global presence, Hasbro remains a significant player in the entertainment and play industry. However, the stock has faced fluctuations recently, reflecting broader market uncertainties.
Trend Analysis
| Date | Close Price | Trend |
|---|---|---|
| 2026-07-20 | 81.59 | ▼ Downtrend |
| 2026-07-17 | 81.55 | ▼ Downtrend |
| 2026-07-16 | 82.09 | ▼ Downtrend |
| 2026-07-15 | 80.51 | ▼ Downtrend |
| 2026-07-14 | 78.42 | ▼ Downtrend |
| 2026-07-13 | 79.53 | ▼ Downtrend |
| 2026-07-10 | 78.96 | ▼ Downtrend |
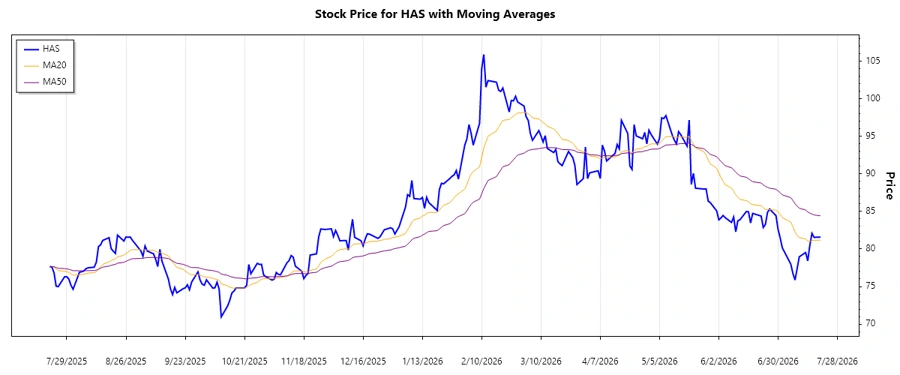
The recent price movements suggest a clear downtrend, with EMA20 below EMA50, indicating bearish momentum. This reflects weak investor sentiment over the analyzed period.
Support and Resistance
| Type | From | To |
|---|---|---|
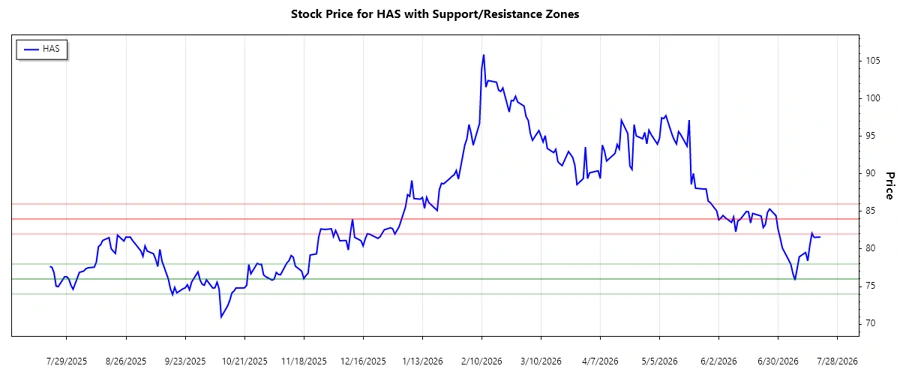
| Support | 76 | 78 |
| Support | 74 | 76 |
| Resistance | 82 | 84 |
| Resistance | 84 | 86 |
The stock is currently trading near its lower support zone, which might offer some relief from further depreciation. Conversely, the established resistance levels may hinder substantial upwards movement.
Conclusion
Hasbro, Inc.'s stock is experiencing a dominant downtrend with prices settling near key support areas. There are opportunities for a potential rebound if the support zones hold strong. However, breaking through these zones could trigger further declines. Resistance levels remain fairly resilient, suggesting limited upside in the short term unless market conditions improve. For investors, this presents a chance to monitor for potential buy-in opportunities around the defined support zones or upon trend reversal indications.
Smart Data Insight
Master the Perfect Entry & Exit for this Stock
Don't leave your profits to chance. Historically, this stock follows specific seasonal patterns that institutional traders use to maximize returns.
- ✅ Identify the "Golden Buying Window"
- ✅ Avoid high-risk correction cycles
- ✅ Backtested data from the last 20+ years