
June 01, 2026 a 02:46 am
HAS: Dividend Analysis - Hasbro, Inc.
Hasbro, Inc. holds a strong position in its sector due to its unwavering dividend history and moderate growth over the years. With a notable yield, it assures investors of a constant return, albeit the recent financial struggles. Evaluating the payout ratios is crucial as it indicates the sustainability of these returns in tandem with the company's revenue streams.
📊 Overview
Hasbro operates in the competitive sector of Consumer Goods. Its current dividend yield stands at 3.25%, providing income-seeking investors with a solid return relative to their investment. The consistent dividend history of 44 years signifies reliability, but attention must be given to its financial health as there is no record of a recent dividend cut or suspension.
| Metric | Value |
|---|---|
| Sector | Consumer Goods |
| Dividend Yield | 3.25% |
| Current Dividend Per Share | $2.80 |
| Dividend History | 44 years |
| Last Cut or Suspension | None |
🗣️ Dividend History
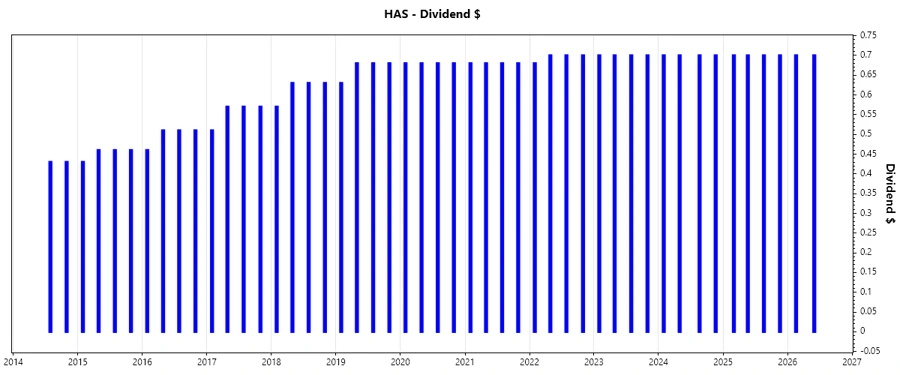
Hasbro's prolonged dividend payment history illustrates its commitment to delivering shareholder value. This history enhances investor confidence as continuous payments indicate stable financial performance over the years, even amidst market fluctuations.
| Year | Dividend Per Share |
|---|---|
| 2026 | $1.40 |
| 2025 | $2.80 |
| 2024 | $2.80 |
| 2023 | $2.80 |
| 2022 | $2.78 |
📈 Dividend Growth
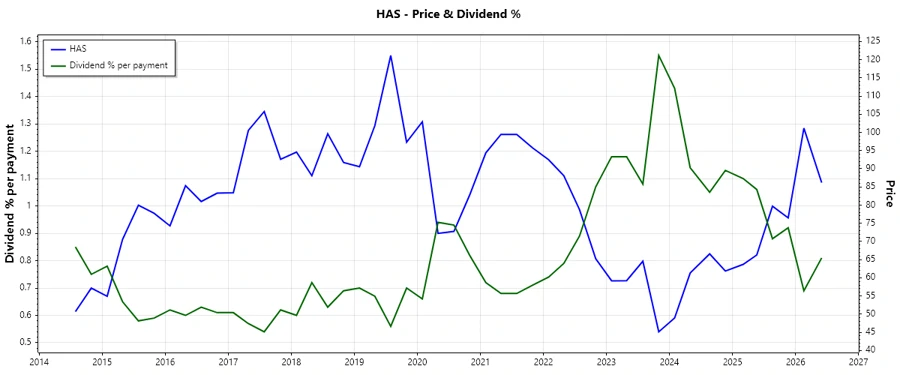
Though there is a modest increase in dividends, with a 5-year growth of 0.58%, it's a clear indication of Hasbro's strategic dividend policies focused on sustainable payouts. This level of growth supports investor expectations of gradual income enhancement over time.
| Time | Growth |
|---|---|
| 3 years | 0.24% |
| 5 years | 0.58% |
The average dividend growth is 0.58% over 5 years. This shows moderate but steady dividend growth.
⚠️ Payout Ratio
The EPS-based payout ratio is alarmingly negative at -177.58%. Such a significant discrepancy calls for a cautious approach as it suggests dividends are not covered by current earnings. On a brighter note, the FCF-based payout ratio is 38.79%, reflecting a more moderate scenario where dividends are covered by cash flows.
| Key Figure | Ratio |
|---|---|
| EPS-based | -177.58% |
| Free Cash Flow-based | 38.79% |
The significant negative EPS payout ratio highlights potential issues with sustainable earnings coverage, whereas the FCF ratio is within a reasonable range, suggesting adequate cash flow management.
✅ Cashflow & Capital Efficiency
Understanding cash flow yields and capital expenditures relative to operating cash provides deep insights into operational efficiency. By managing CAPEX and maintaining good FCF/OCF ratios, Hasbro can ensure continued capital efficiency despite industry challenges.
| Year | 2023 | 2024 | 2025 |
|---|---|---|---|
| Free Cash Flow Yield | 7.29% | 9.75% | 7.15% |
| Earnings Yield | -21.01% | 4.95% | -2.78% |
| CAPEX/OCF | 28.85% | 10.29% | 7.09% |
| Stock-based Compensation/Revenue | 0% | 0% | 0% |
| FCF/OCF Ratio | 71.15% | 89.71% | 92.91% |
The data presents a scenario of efficient cash flow management, highlighted by high FCF ratios and controlled CAPEX levels, essential for investment and dividend strategies.
📉 Balance Sheet & Leverage Analysis
Assessing Hasbro's leverage reveals high debt ratios indicating potential repayment risks. The company relies significantly on debt financing, as evidenced by its high debt-to-equity and financial leverage ratios.
| Year | 2023 | 2024 | 2025 |
|---|---|---|---|
| Debt-to-Equity | 329.25% | 294.63% | 631.59% |
| Debt-to-Assets | 53.45% | 53.79% | 61.26% |
| Debt-to-Capital | 76.70% | 74.66% | 86.33% |
| Net Debt to EBITDA | -341.93% | 308.45% | 1127.85% |
| Current Ratio | 1.13 | N/A | N/A |
| Quick Ratio | 0.97 | 1.40 | 1.24 |
| Financial Leverage | 6.16 | 5.48 | 10.31 |
Financial ratios indicate high leverage and potential liquidity issues, necessitating careful monitoring of debt levels and asset quality.
Fundamental Strength & Profitability
Understanding profitability metrics such as ROE, ROA, and margins are critical as they offer insights into operational efficiency and long-term value creation. Hasbro reflects a mixed profitability trajectory, revealing challenges in maintaining equity and asset returns.
| Year | 2023 | 2024 | 2025 |
|---|---|---|---|
| Return on Equity | -140.25% | 33.31% | -59.87% |
| Return on Assets | -22.77% | 6.08% | -5.81% |
| ROIC | -26.71% | 11.02% | 25.14% |
| Net Profit Margin | -29.77% | 9.32% | -6.86% |
| Gross Profit Margin | 57.34% | 64.61% | 70.26% |
| EBIT Margin | -30.44% | 16.16% | 1.31% |
| EBITDA Margin | -17.25% | 21.29% | 4.95% |
| R&D/Revenue | 6.13% | 7.11% | 8.20% |
The profitability analysis highlights inconsistent returns, suggesting that strategic shifts may be necessary to enhance operational income and market standing.
Price Development
🔍 Dividend Scoring System
| Criteria | Score | Score Bar |
|---|---|---|
| Dividend yield | 4 | |
| Dividend Stability | 5 | |
| Dividend growth | 3 | |
| Payout ratio | 1 | |
| Financial stability | 2 | |
| Dividend continuity | 5 | |
| Cashflow Coverage | 3 | |
| Balance Sheet Quality | 2 |
Total Score: 25/40
Rating
Given its robust dividend history coupled with current financial strains, Hasbro receives a cautious rating. Investors should weigh the dependable income against the company's existing financial adversities, considering both strategic dividend measures and future fiscal improvements.
Smart Data Insight
Master the Perfect Entry & Exit for this Stock
Don't leave your profits to chance. Historically, this stock follows specific seasonal patterns that institutional traders use to maximize returns.
- ✅ Identify the "Golden Buying Window"
- ✅ Avoid high-risk correction cycles
- ✅ Backtested data from the last 20+ years