May 02, 2026 a 07:46 am
HAS: Dividend Analysis - Hasbro, Inc.
Hasbro, Inc., known for its long-standing dividend payout history, offers a promising yield. Despite challenges in past years impacting earnings, the company's generous and consistent dividends demonstrate its commitment to shareholder value. Continuous improvements are essential to maintain stability amidst fluctuating market cap and profitability metrics.
Overview
Hasbro, Inc. has a substantial dividend record spanning several decades, indicating resilience and a structured approach to shareholder returns. The company, under the consumer discretionary umbrella, maintains a respectable dividend yield coupled with a consistent dividend per share performance.
| Metric | Value |
|---|---|
| Sector | Consumer Discretionary |
| Dividend yield | 2.77% |
| Current dividend per share | $2.80 |
| Dividend history | 44 years |
| Last cut or suspension | None |
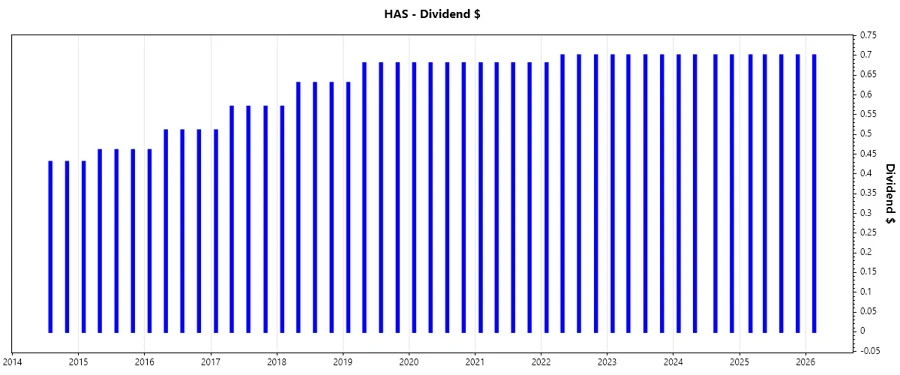
Dividend History
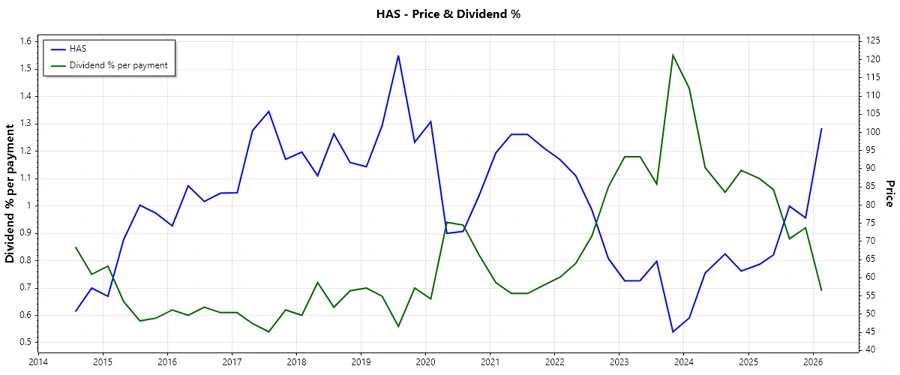
The history of dividends is pivotal in understanding a company's commitment to its shareholders. Hasbro's robust history denotes reliability, although scrutiny over recent payouts is crucial given market shifts.
| Year | Dividend per Share (USD) |
|---|---|
| 2026 | $0.70 |
| 2025 | $2.80 |
| 2024 | $2.80 |
| 2023 | $2.80 |
| 2022 | $2.78 |
Dividend Growth
Understanding dividend growth provides insights into a company's earnings trajectory and financial health. In recent years, Hasbro has demonstrated modest growth, consistent with its sector performance.
| Time | Growth |
|---|---|
| 3 years | 0.24% |
| 5 years | 0.58% |
The average dividend growth is 0.58% over 5 years. This shows moderate but steady dividend growth.
Payout Ratio
Payout Ratios are essential in evaluating how well earnings cover dividends. For Hasbro, a negative EPS-based payout ratio is alarming but the relatively healthy FCF payout indicates manageability.
| Key figure | Ratio |
|---|---|
| EPS-based | -122.00% |
| Free cash flow-based | 47.46% |
The significant disparity between EPS and FCF payout ratios warrants caution. The EPS-based ratio suggests unsustainable payouts, however, the FCF ratio remains within acceptable margins.
Cashflow & Capital Efficiency
Analyzing cash flow and capital efficiency outlines the company's internal financial allocation and resilience. Key metrics suggest potential areas for operational optimization and improvement in efficiency.
| Metric | 2025 | 2024 | 2023 |
|---|---|---|---|
| Free Cash Flow Yield | 7.15% | 9.75% | 7.29% |
| Earnings Yield | -2.78% | 4.95% | -21.01% |
| CAPEX to Operating Cash Flow | 7.09% | 10.29% | 28.85% |
| Stock-based Compensation to Revenue | 0% | 0% | 0% |
| Free Cash Flow / Operating Cash Flow Ratio | 92.91% | 89.71% | 71.15% |
| Return on Invested Capital | 25.14% | 11.02% | -26.71% |
The cash flow figures indicate a relatively stable financial ground, although capital efficiency could benefit from targeted strategic improvements.
Balance Sheet & Leverage Analysis
The balance sheet is pivotal in assessing financial robustness and leverage capacity. Hasbro's high debt ratios necessitate prudent capital management to avoid potential liquidity constraints.
| Metric | 2025 | 2024 | 2023 |
|---|---|---|---|
| Debt-to-Equity | 6.32 | 2.95 | 3.29 |
| Debt-to-Assets | 61.26% | 53.79% | 53.45% |
| Debt-to-Capital | 86.33% | 74.66% | 76.70% |
| Net Debt to EBITDA | 11.28 | 3.08 | -3.42 |
| Current Ratio | 1.38 | 0 | 1.13 |
| Quick Ratio | 1.24 | 1.40 | 0.97 |
| Financial Leverage | 10.31 | 5.48 | 6.16 |
The high debt-to-equity and leverage levels highlight the necessity for enhanced debt management strategies to preserve financial health.
Fundamental Strength & Profitability
This section evaluates intrinsic strength through profitability measures, revealing operational efficacy and market positioning. Earnings volatility has impacted Hasbro's profitability, but recent adjustments promise potential upturns.
| Metric | 2025 | 2024 | 2023 |
|---|---|---|---|
| Return on Equity | -59.87% | 33.31% | -140.25% |
| Return on Assets | -5.81% | 6.08% | -22.77% |
| Net Margin | -6.86% | 9.32% | -29.77% |
| EBIT Margin | 1.31% | 16.16% | -30.44% |
| EBITDA Margin | 4.95% | 21.29% | -17.25% |
| Gross Margin | 70.26% | 64.61% | 57.34% |
| R&D to Revenue | 8.20% | 7.11% | 6.13% |
While recent figures have been challenging, concerted efforts to bolster production efficiency can potentially enhance profitability and market competitiveness.
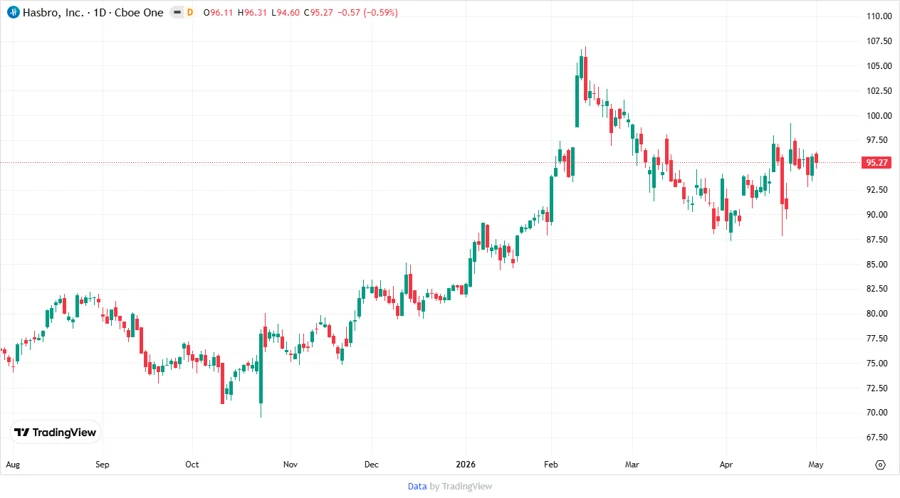
Price Development
Dividend Scoring System
| Criteria | Score | |
|---|---|---|
| Dividend yield | 3 | |
| Dividend Stability | 4 | |
| Dividend growth | 2 | |
| Payout ratio | 3 | |
| Financial stability | 2 | |
| Dividend continuity | 4 | |
| Cashflow Coverage | 3 | |
| Balance Sheet Quality | 2 |
Total Score: 23 out of 40 Points
Rating
Given its extensive dividend history and current industry position, Hasbro, Inc. remains an attractive option for income-focused investors. However, potential investments should be cautious of financial stability metrics and potential risks associated with high debt and leveraged positions. A stable to positive outlook is achievable with targeted strategic enhancements to bolster profitability and capital efficiency.
Smart Data Insight
Master the Perfect Entry & Exit for this Stock
Don't leave your profits to chance. Historically, this stock follows specific seasonal patterns that institutional traders use to maximize returns.
- ✅ Identify the "Golden Buying Window"
- ✅ Avoid high-risk correction cycles
- ✅ Backtested data from the last 20+ years