April 10, 2026 a 07:31 am


HAS: Dividend Analysis - Hasbro, Inc.
Hasbro, Inc. offers a diversified dividend profile with a current yield of approximately 2.77%, supported by a substantial history of dividend payments. However, negative EPS payout ratios indicate underlying profit challenges, necessitating careful watch of financial stability and potential adjustments.
📊 Overview
Hasbro's dividend profile is characterized by a moderate yield of 2.77% and a notable dividend history spanning 44 years without recent cuts. This implies robust dividend continuity, although the high EPS payout may indicate pressure on earnings sustainability.
| Metric | Value |
|---|---|
| Sector | Consumer Discretionary |
| Dividend Yield | 2.77% |
| Current Dividend per Share | 2.80 USD |
| Dividend History | 44 years |
| Last Cut or Suspension | None |
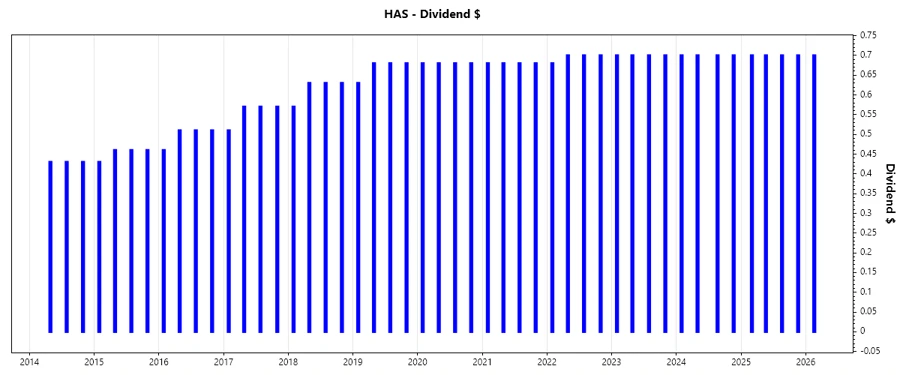
📈 Dividend History
Hasbro's dividend history showcases consistent payouts, reflecting reliable shareholder returns. This continuity bolsters investor confidence and underpins the company's reputation as a stalwart dividend payer.
| Year | Dividend per Share |
|---|---|
| 2026 | 0.70 USD |
| 2025 | 2.80 USD |
| 2024 | 2.80 USD |
| 2023 | 2.80 USD |
| 2022 | 2.78 USD |
📉 Dividend Growth
The dividend growth over three and five years highlights Hasbro's modest but steady payout expansion. Sustained growth reflects management's commitment to enhancing shareholder value despite market pressures.
| Time | Growth |
|---|---|
| 3 years | 0.24% |
| 5 years | 0.58% |
The average dividend growth is 0.58% over five years. This shows moderate but steady dividend growth.
✅ Payout Ratio
Payout ratios are crucial in assessing dividend sustainability. Hasbro demonstrates a troubling negative EPS-based payout ratio, cautioning that the dividends may rely on sources beyond earned profits.
| Key Figure | Ratio |
|---|---|
| EPS-based | -122.00% |
| Free Cash Flow-based | 47.46% |
With an EPS payout of -122.00%, dividends appear at risk without net profits, signaling potential investment risks.
💵 Cashflow & Capital Efficiency
These metrics are vital for understanding the company's operational robustness and investment prowess. Stable levels of Free Cash Flow Yield and Earnings Yield show potential, though they remain overshadowed by higher capital demands and stock-based compensation figures.
| Metric | 2025 | 2024 | 2023 |
|---|---|---|---|
| Free Cash Flow Yield | 7.15% | 9.79% | 7.29% |
| Earnings Yield | -2.78% | 4.97% | -21.01% |
| CAPEX to Operating Cash Flow | 7.09% | 10.29% | 28.85% |
| Stock-based Compensation to Revenue | 0% | 0% | 0% |
| Free Cash Flow / Operating Cash Flow Ratio | 92.91% | 89.71% | 71.15% |
The firm's cash flows remain restrained by moderate capital activity, affecting overall financial flexibility.
🔍 Balance Sheet & Leverage Analysis
Hasbro's leverage ratios suggest a significant dependence on debt financing. High Debt-to-Equity and Net Debt to EBITDA ratios necessitate cautious evaluation of long-term solvency and risk of financial distress.
| Metric | 2025 | 2024 | 2023 |
|---|---|---|---|
| Debt-to-Equity | 6.32 | 2.95 | 3.29 |
| Debt-to-Assets | 61.26% | 53.79% | 53.45% |
| Debt-to-Capital | 86.33% | 74.66% | 76.70% |
| Net Debt to EBITDA | 11.28 | 3.08 | -3.42 |
| Current Ratio | 1.38 | 1.60 | 1.13 |
| Quick Ratio | 1.24 | 1.40 | 0.97 |
| Financial Leverage | 10.31 | 5.48 | 6.16 |
While liquidity ratios offer relative comfort, the high leverage points to increased financial risk, mandating prudent management.
📋 Fundamental Strength & Profitability
The profitability analysis shows fluctuating performance, with inconsistent margins and returns reflecting significant external and operational challenges. Hasbro's focus on R&D continues to impact revenue efficiency, balanced against potential for innovation-driven growth.
| Metric | 2025 | 2024 | 2023 |
|---|---|---|---|
| Return on Equity | -59.87% | 33.31% | -140.25% |
| Return on Assets | -5.81% | 6.08% | -22.77% |
| Margins: Net | -6.86% | 9.32% | -29.77% |
| EBIT | 1.31% | 16.16% | -30.44% |
| EBITDA | 4.95% | 21.29% | -17.25% |
| Gross | 70.26% | 64.61% | 57.34% |
| R&D to Revenue | 8.20% | 7.11% | 6.13% |
Continual R&D investment underlines future growth initiatives but requires judicious balancing against immediate fiscal pressures.
🚀 Price Development
🏅 Dividend Scoring System
| Criterion | Score (1-5) | Score Bar |
|---|---|---|
| Dividend Yield | 3 | |
| Dividend Stability | 5 | |
| Dividend Growth | 2 | |
| Payout Ratio | 1 | |
| Financial Stability | 2 | |
| Dividend Continuity | 5 | |
| Cashflow Coverage | 3 | |
| Balance Sheet Quality | 2 |
Total Score: 23/40
🗣️ Rating
Hasbro manifests an enviable dividend history and stable continuity; however, significant profit and leverage issues could compromise future payouts. Investors should exercise caution due to high dependence on debt and negative profitability indicators. A "Hold" recommendation is prudent as management addresses sustainable growth and fiscal balance.
Smart Data Insight
Master the Perfect Entry & Exit for this Stock
Don't leave your profits to chance. Historically, this stock follows specific seasonal patterns that institutional traders use to maximize returns.
- ✅ Identify the "Golden Buying Window"
- ✅ Avoid high-risk correction cycles
- ✅ Backtested data from the last 20+ years