January 08, 2026 a 07:31 am
HAS: Dividend Analysis - Hasbro, Inc.
Hasbro, Inc. demonstrates a strong dividend history with consistent payments. Given the ongoing commitment to shareholder value, as evidenced by the 43-year dividend history, the company's dividend profile remains robust. However, recent financial challenges pose questions regarding its long-term dividend sustainability. Their dividend yield remains attractive at 3.66%, although payout ratios indicate potential areas of concern.
📊 Overview
Hasbro, Inc. operates within a competitive sector yet demonstrates an impressive dividend track record. Consistent dividend payment over the years highlights the company's steadfast commitment to rewarding shareholders.
| Category | Detail |
|---|---|
| Sector | Consumer Discretionary |
| Dividend Yield | 3.66% |
| Current Dividend Per Share | 2.80 USD |
| Dividend History | 43 years |
| Last Cut or Suspension | 2013 |
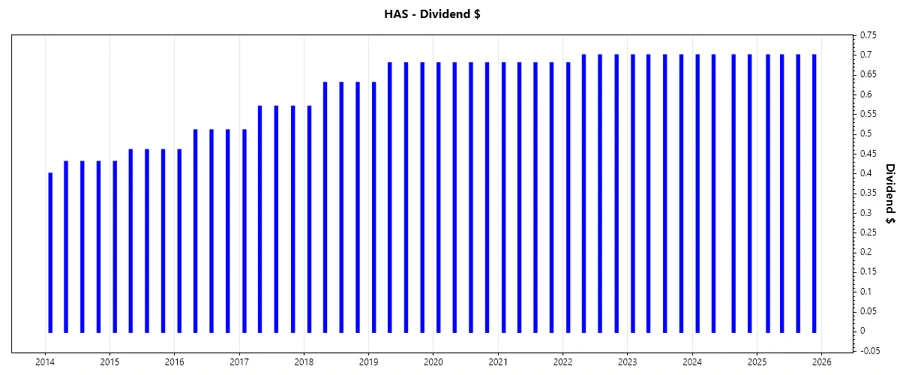
🗣️ Dividend History
Investors value Hasbro's history of increasing dividends, which can signal company strength and stability. The steady growth over decades builds investor trust and enhances perceived reliability.
| Year | Dividend Per Share (USD) |
|---|---|
| 2025 | 2.80 |
| 2024 | 2.80 |
| 2023 | 2.80 |
| 2022 | 2.78 |
| 2021 | 2.72 |
📈 Dividend Growth
A company's ability to grow dividends consistently is a critical metric for assessing its financial health and commitment to return capital to shareholders.
| Time | Growth |
|---|---|
| 3 years | 0.24% |
| 5 years | 0.58% |
The average dividend growth is 0.58% over 5 years. This shows moderate but steady dividend growth.
⚠️ Payout Ratio
The payout ratio is pivotal in determining dividend sustainability. High ratios can indicate the company may be overextending, potentially risking future dividend stability.
| Key Figure | Ratio |
|---|---|
| EPS-based | -70.34% |
| Free Cash Flow-based | 60.49% |
The negative EPS-based payout ratio presents concerns about profits covering dividends, whereas the FCF-based ratio offers a less alarming outlook.
📉 Cashflow & Capital Efficiency
Investigating a company's cash flow and capital efficiency parameters helps in understanding its operational efficacy and future investment potential.
| Parameter | 2024 | 2023 | 2022 |
|---|---|---|---|
| Free Cash Flow Yield | 9.79% | 7.45% | 2.35% |
| Earnings Yield | 4.97% | -21.50% | 2.40% |
| CAPEX to Operating Cash Flow | 10.29% | 28.85% | 46.71% |
| Stock-based Compensation to Revenue | 0% | 0% | 0% |
| Free Cash Flow / Operating Cash Flow Ratio | 89.71% | 71.15% | 53.29% |
The metrics suggest mixed cash flow stability with an improving trend in FCF yield and cash flow ratio, enhancing capital allocation efficiency.
Balance Sheet & Leverage Analysis
A comprehensive balance sheet and leverage analysis is critical for assessing financial health, specifically liquidity and solvency to manage and pay debts.
| Parameter | 2024 | 2023 | 2022 |
|---|---|---|---|
| Debt-to-Equity | 2.95 | 3.29 | 1.41 |
| Debt-to-Assets | 53.79% | 53.45% | 43.10% |
| Debt-to-Capital | 74.66% | 76.70% | 58.58% |
| Net Debt to EBITDA | 3.08 | -3.42 | 2.87 |
| Current Ratio | 1.60 | 1.13 | 1.37 |
| Quick Ratio | 1.40 | 0.97 | 1.06 |
| Financial Leverage | 5.48 | 6.16 | 3.28 |
The analysis reveals high leverage, indicating potential risks in debt levels, yet current and quick ratios show adequate liquidity.
Fundamental Strength & Profitability
Exploring fundamentals such as profitability ratios demonstrates operational efficiency and value creation for shareholders.
| Parameter | 2024 | 2023 | 2022 |
|---|---|---|---|
| Return on Equity | 33.31% | -140.25% | 7.18% |
| Return on Assets | 6.08% | -22.77% | 2.19% |
| Margins: Net | 9.32% | -29.77% | 3.47% |
| EBIT | 16.16% | -30.44% | 7.38% |
| EBITDA | 21.29% | -17.25% | 20.84% |
| Gross | 64.61% | 57.34% | 58.94% |
| R&D to Revenue | 7.11% | 6.13% | 5.26% |
Hasbro's profitability is volatile with ROE fluctuations, however investment in R&D indicates continued growth potential.
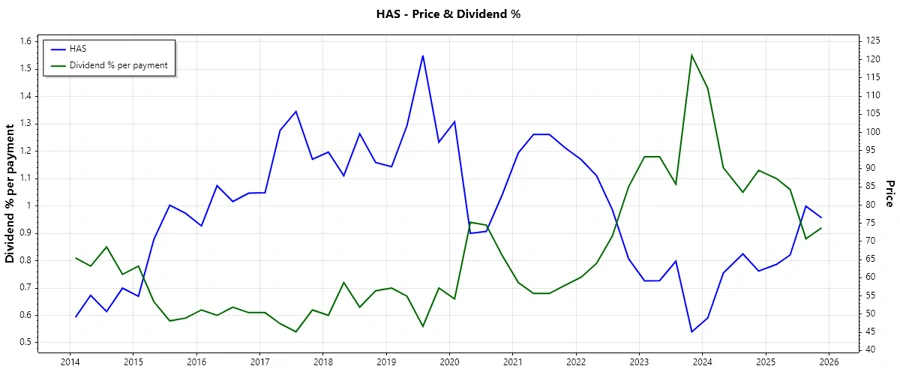
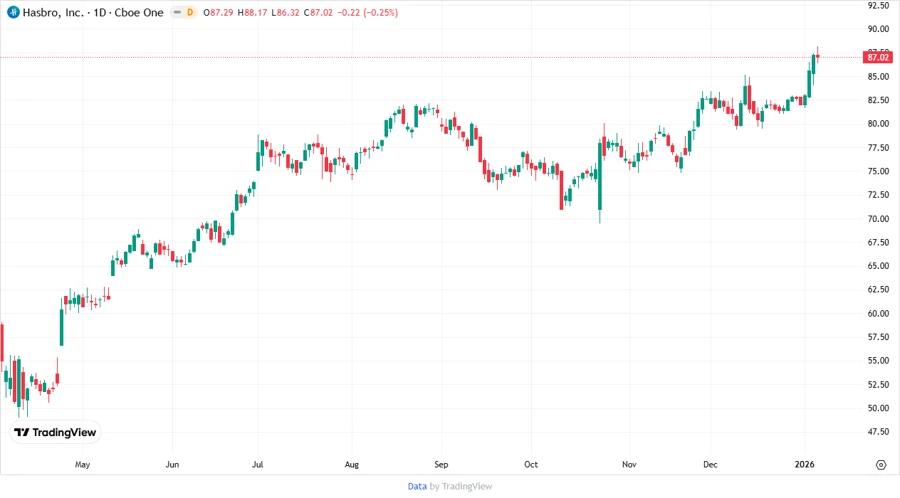
Price Development
Dividend Scoring System
| Criteria | Score | Score Bar |
|---|---|---|
| Dividend yield | 4 | |
| Dividend Stability | 5 | |
| Dividend growth | 3 | |
| Payout ratio | 2 | |
| Financial stability | 3 | |
| Dividend continuity | 5 | |
| Cashflow Coverage | 3 | |
| Balance Sheet Quality | 2 |
Total Score: 27/40
Rating
While Hasbro, Inc. displays an attractive dividend yield and solid dividend history, the high leverage and fluctuating returns underscore potential risks. Nonetheless, its continued investment in growth avenues may mitigate some concerns. Investment is recommended for dividend-focused portfolios, albeit with caution due to financial volatility.