December 13, 2025 a 03:31 am
HAS: Dividend Analysis - Hasbro, Inc.
Hasbro, Inc., established as a giant in the toy industry, offers a distinguished dividend profile with a history of consistent payments. Despite its market fluctuations, the company strives for dividend consistency, reflecting stability for income-seeking investors. However, certain financial challenges have emerged, impacting its profitability metrics. Therefore, a comprehensive analysis of its financial sustainability for dividends is crucial.
📊 Overview
Hasbro, Inc. shows resilience with a commendable dividend track record spanning over four decades. Its dividend yield of 3.66% is competitive, indicating a reliable income stream for shareholders, although recent fiscal challenges may affect its future payouts.
| Metric | Value |
|---|---|
| Sector | Consumer Discretionary |
| Dividend Yield | 3.66% |
| Current Dividend per Share | 2.80 USD |
| Dividend History | 43 years |
| Last Cut or Suspension | 2013 |
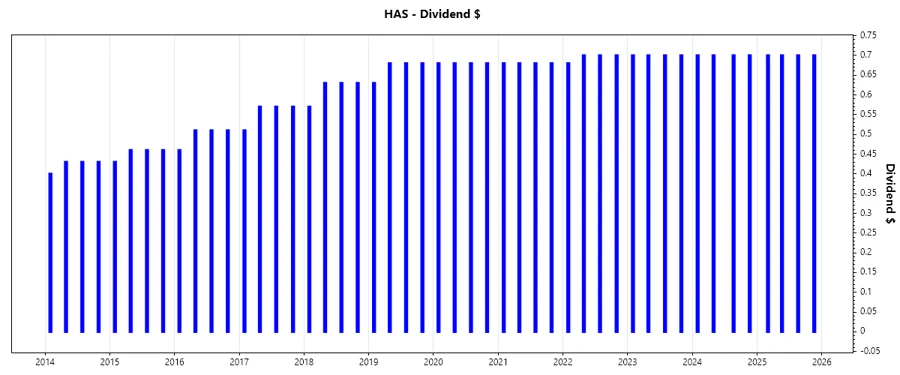
📈 Dividend History
With 43 consecutive years of dividend payments, Hasbro demonstrates a robust dividend history, showcasing its commitment to returning capital to shareholders. Despite past challenges, the steady dividend payments serve as a testament to its financial durability. The recent stability in dividends could suggest a strategic focus on maintaining shareholder confidence.
| Year | Dividend per Share (USD) |
|---|---|
| 2025 | 2.80 |
| 2024 | 2.80 |
| 2023 | 2.80 |
| 2022 | 2.78 |
| 2021 | 2.72 |
📈 Dividend Growth
Consistent dividend growth is essential for long-term investors as it indicates management's confidence in the company's cash flow potential. While Hasbro's growth rate is modest, it indicates a gradual enhancement in shareholder returns.
| Time | Growth |
|---|---|
| 3 years | 0.97% |
| 5 years | 0.95% |
The average dividend growth is 0.95% over 5 years. This shows moderate but steady dividend growth.
🗣️ Payout Ratio
The payout ratio gauges a company’s ability to maintain dividend payments from its earnings. A payout ratio over 100% may suggest the dividend is at risk, especially if sustained over a prolonged period. Hasbro's negative EPS payout ratio raises concerns about reliance on earnings to support dividend distribution, potentially pressuring future payouts.
| Key figure | Ratio |
|---|---|
| EPS-based | -70.34% |
| Free cash flow-based | 60.49% |
A negative EPS payout ratio indicates Hasbro is paying dividends beyond its earnings capacity, relying on cash flow to sustain dividends.
📈 Cashflow & Capital Efficiency
Cash flow stability and capital efficiency are vital indicators of a company's ability to invest and return capital to shareholders. Hasbro's financial data offers insights into its operational strengths and capital allocation strategy.
| 2024 | 2023 | 2022 | |
|---|---|---|---|
| Free Cash Flow Yield | 9.79% | 7.45% | 2.35% |
| Earnings Yield | 4.97% | -21.50% | 2.40% |
| CAPEX to Operating Cash Flow | 10.29% | 28.85% | 46.71% |
| Stock-based Compensation to Revenue | 0% | 0% | 0% |
| Free Cash Flow / Operating Cash Flow Ratio | 89.71% | 71.15% | 53.28% |
Although capital efficiency seems robust, Hasbro's declining cash flow ratios in recent years may impact investment flexibility and distributions.
📉 Balance Sheet & Leverage Analysis
Analyzing leverage and liquidity positions assists in assessing a company's ability to manage its debts and financial obligations. Hasbro's high leverage ratios could hinder its financial flexibility.
| 2024 | 2023 | 2022 | |
|---|---|---|---|
| Debt-to-Equity | 2.95 | 3.29 | 1.41 |
| Debt-to-Assets | 0.54 | 0.53 | 0.43 |
| Debt-to-Capital | 0.75 | 0.77 | 0.59 |
| Net Debt to EBITDA | 3.08 | -3.42 | 2.87 |
| Current Ratio | 1.60 | 1.13 | 1.37 |
| Quick Ratio | 1.40 | 0.97 | 1.06 |
| Financial Leverage | 5.48 | 6.16 | 3.28 |
The elevated levels of debt-to-equity and financial leverage highlight potential risks in terms of financial stability and flexibility.
✅ Fundamental Strength & Profitability
Evaluating key profitability ratios helps in understanding a firm's operating efficiency and financial health, aiding in strategic investment decisions. Hasbro's recent performance underscores ongoing challenges in optimizing asset efficiency.
| 2024 | 2023 | 2022 | |
|---|---|---|---|
| ROE | 33.31% | -140.25% | 7.18% |
| ROA | 6.08% | -22.77% | 2.19% |
| Margins | NP 9.32%, GP 64.61%, EBIT 16.16%, EBITDA 21.29% | NP -29.77%, GP 57.34%, EBIT -30.44%, EBITDA -17.25% | NP 3.47%, GP 58.94%, EBIT 7.38%, EBITDA 20.84% |
| R&D to Revenue | 7.11% | 6.13% | 5.26% |
Hasbro's fluctuating profitability ratios reflect the challenges it faces in maintaining consistent operational profitability amid industry pressure.
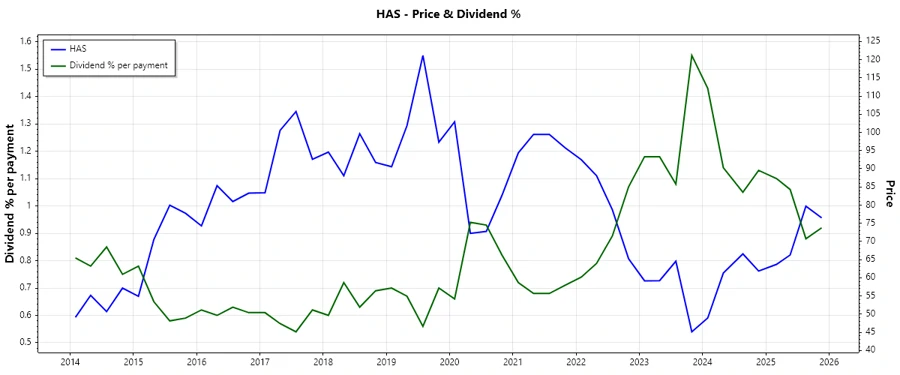
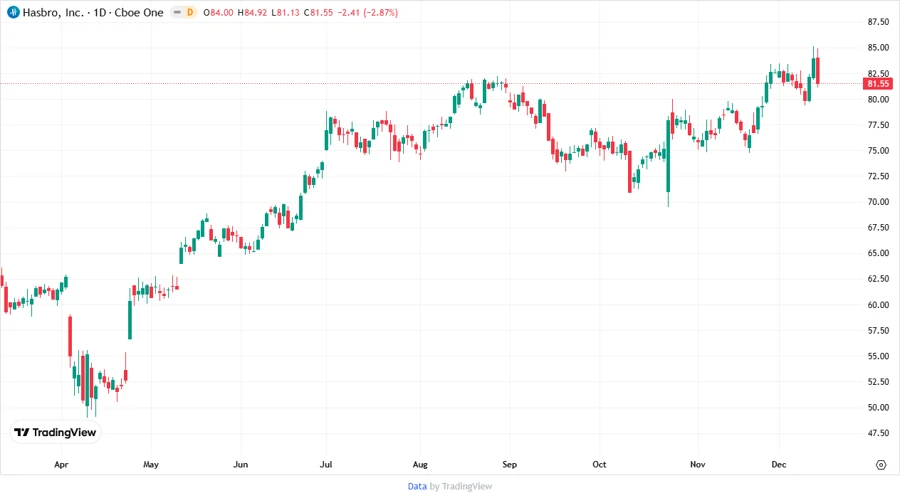
📊 Price Development
📊 Dividend Scoring System
| Category | Score | |
|---|---|---|
| Dividend Yield | 4 | |
| Dividend Stability | 5 | |
| Dividend Growth | 2 | |
| Payout Ratio | 1 | |
| Financial Stability | 2 | |
| Dividend Continuity | 4 | |
| Cashflow Coverage | 3 | |
| Balance Sheet Quality | 2 |
Total Score: 23/40
⚠️ Rating
In conclusion, Hasbro maintains a consistent dividend policy; however, financial metrics reveal significant challenges, particularly regarding profitability and leverage, affecting its dividend sustainability. While offering an attractive yield, potential investors must weigh these risks carefully. A cautiously optimistic stance is advised for those focusing on income potential, barring any material operational turnaround in near-term fundamentals.