July 06, 2025 a 11:31 am

HAS: Dividend Analysis - Hasbro, Inc.
Hasbro, Inc. has demonstrated a consistent dividend growth policy, making it an attractive investment for income-focused investors. Despite moderate challenges in recent years, Hasbro has maintained an impressive 43-year history of dividend payments, showcasing resilience and dedication to rewarding shareholders. The current dividend yield of 4.22% provides a healthy income stream amid market fluctuations.
📊 Overview
Hasbro, Inc. operates in the consumer discretionary sector, known for its resilience and growth potential in the entertainment industry. The company's dividend yield of 4.22% is competitive within the market, providing an attractive income to investors. With a robust history of 43 years of consistent dividend payments, and considering the lack of recent cuts or suspensions, Hasbro remains a stable dividend-paying entity in a volatile market environment.
| Sector | Dividend Yield | Current Dividend Per Share | Dividend History | Last Cut/Suspension |
|---|---|---|---|---|
| Consumer Discretionary | 4.22% | 2.80 USD | 43 years | None |
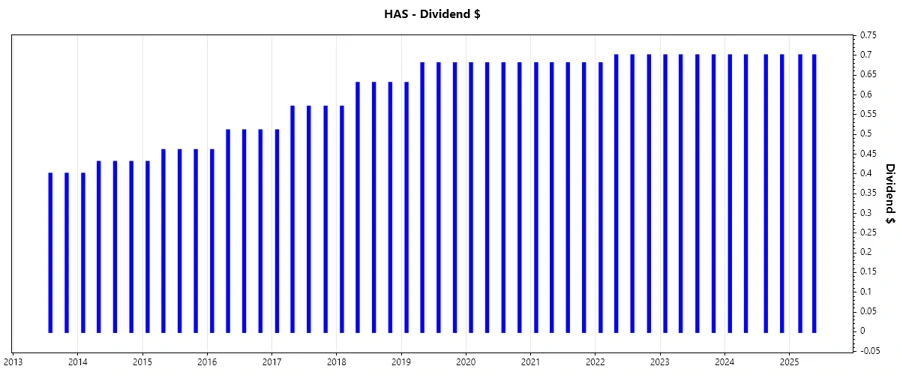
🗣️ Dividend History
The dividend history of Hasbro, Inc. highlights its commitment to shareholder value, as evidenced by its extensive track record. These consistent payments over four decades signal financial prudence and organizational stability, making it a reliable income stock.
| Year | Dividend Per Share |
|---|---|
| 2025 | 1.4 USD |
| 2024 | 2.8 USD |
| 2023 | 2.8 USD |
| 2022 | 2.78 USD |
| 2021 | 2.72 USD |
📈 Dividend Growth
Consistent and incremental growth in dividends is vital as it reflects the company's ability to generate sustainable earnings. However, Hasbro's dividend growth over the last 3 and 5 years has been minimal, pointing towards challenges faced in maintaining rapid expansion while maintaining investor payouts.
| Time | Growth |
|---|---|
| 3 years | 0.97% |
| 5 years | 0.96% |
The average dividend growth is 0.96% over 5 years. This shows moderate but steady dividend growth.
📉 Payout Ratio
The payout ratio provides insights into the sustainability of dividend payments. High payout ratios can indicate risk but also show that a company prioritizes shareholder returns. With an EPS-based payout ratio of 91.79% and an FCF-based payout ratio of 61.03%, Hasbro is on the higher end, suggesting aggressive payout policies that may limit future growth investments.
| Key figure ratio | Percentage |
|---|---|
| EPS-based | 91.79% |
| Free cash flow-based | 61.03% |
While the EPS payout reflects significant allocation to dividends, the FCF payout ratio denotes a slightly more balanced approach. Investors should be aware of potential constraints on financial flexibility.
✅ Cashflow & Capital Efficiency
Effective cash flow management and capital efficiency are essential for sustaining dividends and investing in growth. Hasbro's recent financial performance suggests challenges in maintaining strong cash flow ratios, which are crucial for covering operational expenses and dividends.
| Metric | 2024 | 2023 | 2022 |
|---|---|---|---|
| Free Cash Flow Yield | 9.79% | 7.45% | 2.46% |
| Earnings Yield | 4.96% | -21.50% | 2.52% |
| CAPEX to Operating Cash Flow | 10.29% | 28.84% | 46.71% |
| Stock-based Compensation to Revenue | 1.23% | 1.45% | 1.42% |
The data indicates slight impairments in operational efficiency, underpinned by observable trends of lower yields and increased CAPEX-to-cash flow allocations, necessitating attention to balance sustained growth and financial health.
⚠️ Balance Sheet & Leverage Analysis
A robust balance sheet provides confidence in a company's ability to meet its financial obligations. Hasbro demonstrates some leverage, which demands careful management to avoid liquidity stresses, potentially impacting dividend security.
| Metric | 2024 | 2023 | 2022 |
|---|---|---|---|
| Debt-to-Equity | 2.95 | 3.41 | 1.39 |
| Debt-to-Assets | 0.54 | 0.55 | 0.43 |
| Debt-to-Capital | 0.75 | 0.77 | 0.58 |
| Net Debt to EBITDA | 3.08 | 3.56 | 2.83 |
| Current Ratio | PA | PA | PA |
| Quick Ratio | 1.40 | 0.97 | 1.06 |
While leverage metrics signify manageable current levels, perks in debt management systems assure ongoing capital access and expanded fiscal room. However, heightened attention is needed to ensure adequate liquidity balances and reduce requisite risks.
🔍 Fundamental Strength & Profitability
Profitability and fundamental strength are flags of sustainable company growth. Hasbro's performance levels indicate mixed results, highlighting room for improvement in amplifying efficiency and profit margins.
| Metric | 2024 | 2023 | 2022 |
|---|---|---|---|
| Return on Equity | 33.31% | -140.25% | 7.11% |
| Return on Assets | 6.08% | -22.77% | 2.19% |
| Net Profit Margin | 9.32% | -29.77% | 3.47% |
| EBIT Margin | 16.16% | -30.44% | 7.38% |
| EBITDA Margin | 21.29% | -17.25% | 20.84% |
| Gross Margin | 64.61% | 57.34% | 58.94% |
Although profitable in certain areas, recent fundamental challenges suggest areas for strategized developments, with substantial focus needed around defined profit enhancements.
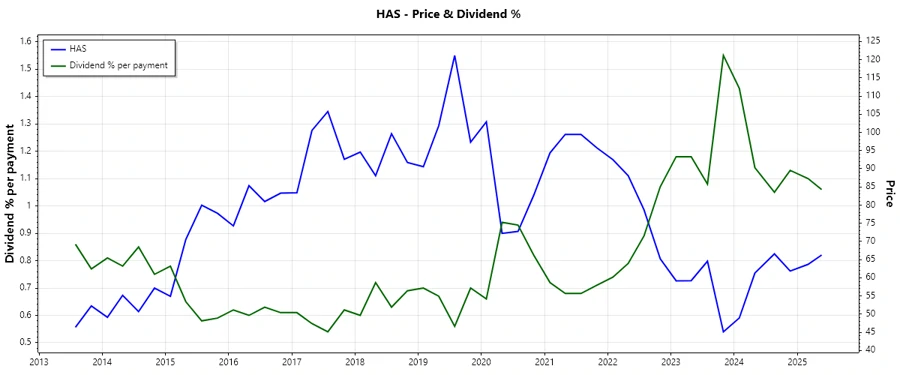
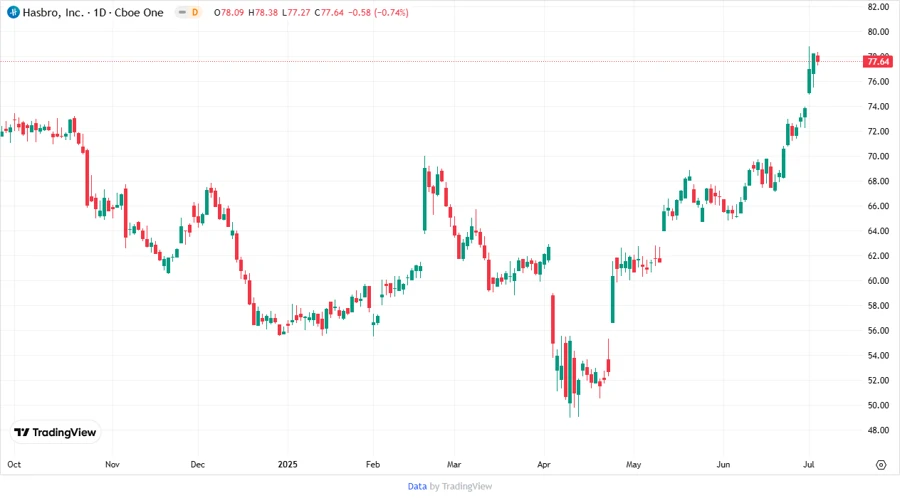
📉 Price Development
✅ Dividend Scoring System
| Criteria | Score | Score Bar |
|---|---|---|
| Dividend Yield | 3 | |
| Dividend Stability | 4 | |
| Dividend Growth | 2 | |
| Payout Ratio | 3 | |
| Financial Stability | 3 | |
| Dividend Continuity | 5 | |
| Cashflow Coverage | 2 | |
| Balance Sheet Quality | 3 |
Total Score: 25/40
🌟 Rating
Hasbro, Inc.'s strong commitment to dividends and demonstrated resilience in sustaining payments indicate it is a steady choice for dividend-focused investors. However, profitability and growth prospects suggest caution, particularly as financial flexibilities tighten amidst increasing fiscal challenges. Investors are advised to consider their risk appetites in relation to income dependencies.
Smart Data Insight
Master the Perfect Entry & Exit for this Stock
Don't leave your profits to chance. Historically, this stock follows specific seasonal patterns that institutional traders use to maximize returns.
- ✅ Identify the "Golden Buying Window"
- ✅ Avoid high-risk correction cycles
- ✅ Backtested data from the last 20+ years