November 16, 2025 a 04:03 am

HAL: Trend and Support & Resistance Analysis - Halliburton Company
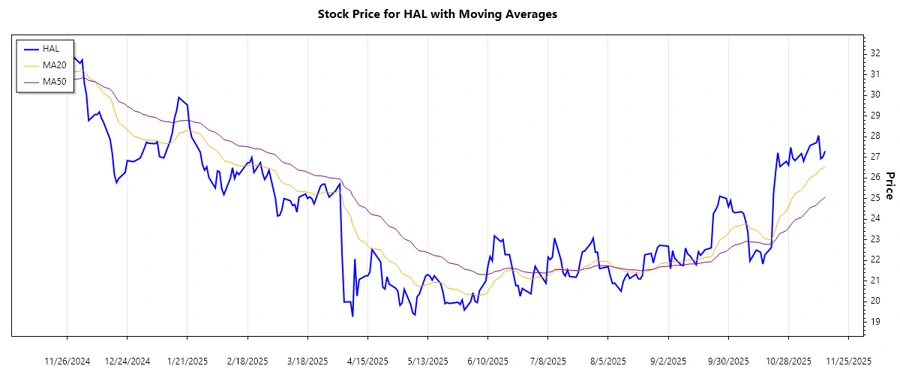
Halliburton Company, a significant player in the energy sector, shows a mixed trend in its recent stock performance. The analysis will help us understand key trends and identify support and resistance zones. An examination of EMAs suggests complexities in stock movements, indicating caution for potential investors. Understanding these dynamics is critical for informed decision-making.
Trend Analysis
Upon analyzing the recent data for Halliburton Company, we calculate the Exponential Moving Averages (EMA) over the last 20 and 50 days. The comparison of EMA20 and EMA50 will highlight prevailing trends. Here's a snapshot of the past week's trend movements:
| Date | Close Price | Trend |
|---|---|---|
| 2025-11-14 | 27.30 | ▲ |
| 2025-11-13 | 27.02 | ▲ |
| 2025-11-12 | 26.93 | ▲ |
| 2025-11-11 | 28.06 | ▲ |
| 2025-11-10 | 27.71 | ▲ |
| 2025-11-07 | 27.57 | ▲ |
| 2025-11-06 | 27.33 | ▲ |
The trend suggests a continuation of growth, as indicated by the EMA calculations, demonstrating market confidence at this time.
Support and Resistance
In assessing the support and resistance levels, key zones are identified based on historical price data. These levels can provide insight into potential price boundaries:
| Zone Type | From | To |
|---|---|---|
| Support 1 | 22.50 | 22.80 |
| Support 2 | 22.00 | 22.49 |
| Resistance 1 | 27.25 | 27.50 |
| Resistance 2 | 27.75 | 28.00 |
The current price is approaching a resistance zone, which could serve as a significant barrier, limiting further upward movement.
Conclusion
The recent analysis of Halliburton Company's stock indicates an upward trend, with support and resistance levels clearly defined. Investors should notice the proximity to resistance zones, which might challenge further gains. While the company remains a strong industry participant, the market conditions warrant caution. The supports remain critical levels to watch for any potential price corrections. Technical analysis reinforces the significance of approaching investments with strategic awareness.
Smart Data Insight
Master the Perfect Entry & Exit for this Stock
Don't leave your profits to chance. Historically, this stock follows specific seasonal patterns that institutional traders use to maximize returns.
- ✅ Identify the "Golden Buying Window"
- ✅ Avoid high-risk correction cycles
- ✅ Backtested data from the last 20+ years