
July 13, 2026 a 10:15 am
HAL: Fibonacci Analysis - Halliburton Company
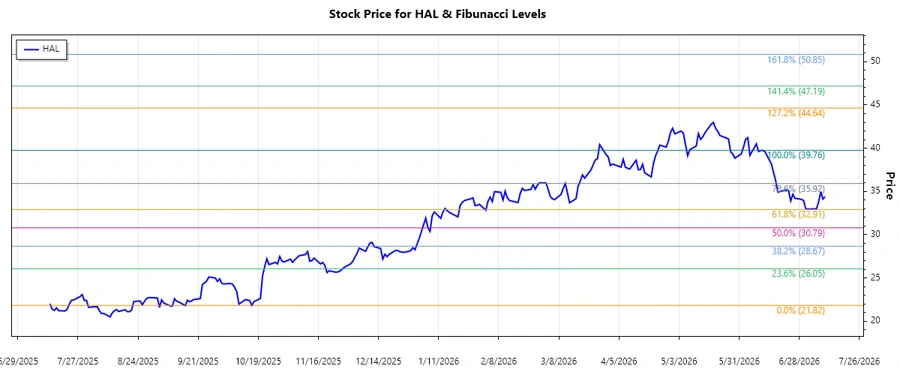
The Halliburton Company stock has seen varied movements in the past months, leading to the identification of a recent market trend. The analysis reveals the stock followed a dominant upward trend over the period which suggests positive investor confidence in this sector. Investors should consider recent support and resistance levels to better understand potential future price movements.
Fibonacci Analysis
| Parameter | Value |
|---|---|
| Trend Start Date | 2025-10-15 |
| Trend End Date | 2026-06-12 |
| High Point (Price & Date) | 39.76 on 2026-06-11 |
| Low Point (Price & Date) | 21.82 on 2025-10-16 |
| 0.236 Fibonacci Level | 26.23 |
| 0.382 Fibonacci Level | 28.71 |
| 0.5 Fibonacci Level | 30.79 |
| 0.618 Fibonacci Level | 32.87 |
| 0.786 Fibonacci Level | 35.54 |
| Current Price | 34.39 |
| Retracement Zone | 0.618 |
| Interpretation | The current price is in the 0.618 retracement zone, indicating potential support. |
Conclusion
The Halliburton Company has exhibited a significant upward trend over the past several months, with the current price tracking within the golden ratio's 0.618 Fibonacci retracement level. This could potentially act as a support point for the stock. However, external market conditions and sector-specific developments could influence future movements. Investors should remain aware of potential resistance levels as the stock approaches prior highs, ensuring a comprehensive approach when considering entry or exit strategies.
Smart Data Insight
Master the Perfect Entry & Exit for this Stock
Don't leave your profits to chance. Historically, this stock follows specific seasonal patterns that institutional traders use to maximize returns.
- ✅ Identify the "Golden Buying Window"
- ✅ Avoid high-risk correction cycles
- ✅ Backtested data from the last 20+ years