June 26, 2026 a 05:15 amjson
HAL: Fibunacci Analysis - Halliburton Company
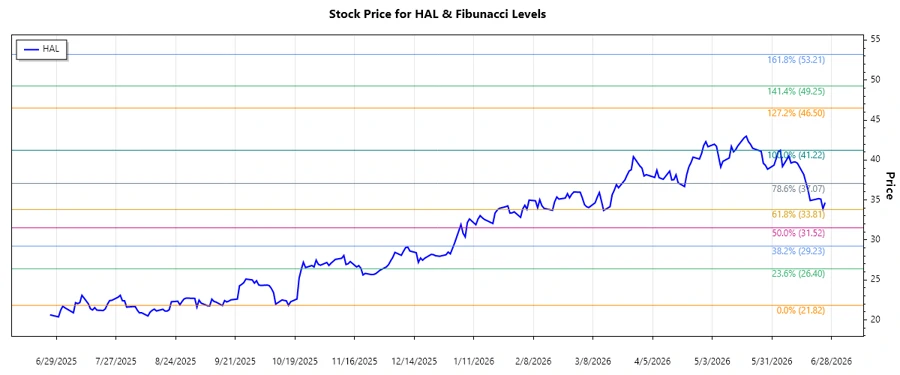
The Halliburton Company (HAL) has experienced a significant uptrend as evident from the historical data spanning several months. As a global energy sector supplier, Halliburton's stock price performance has been noteworthy, reflecting both its operational strength and market dynamics. Recent market movements and technical indicators suggest potential pivotal points, making it a stock to watch for potential investment opportunities.
Fibunacci Analysis
| Start Date | End Date | High Price | Low Price | Fibonacci Level | Level Price |
|---|---|---|---|---|---|
| 2025-10-16 | 2026-06-04 | $41.22 on 2026-06-04 | $21.82 on 2025-10-16 | 0.236 | $37.14 |
| - | - | - | - | 0.382 | $34.03 |
| - | - | - | - | 0.5 | $31.52 |
| - | - | - | - | 0.618 | $29.01 |
| - | - | - | - | 0.786 | $25.78 |
The current price of $34.67 is within the 38.2% Fibonacci retracement level, suggesting a potential support area that might provide an opportunity for bullish activity. A breakthrough below this level could indicate further downside risk or a consolidating phase.
Conclusion
The upward trend in Halliburton's stock price demonstrates the company's resilience and potential as a formidable player in the energy sector. However, the current positioning within the 38.2% Fibonacci retracement suggests cautious monitoring for a potential support breach. Analysts need to be vigilant about macroeconomic factors and industry-specific challenges that might affect Halliburton's market performance. The technical signals present both opportunities for gains and risks of further retracement, advising a balanced approach to investment strategies relating to HAL stocks.
Smart Data Insight
Master the Perfect Entry & Exit for this Stock
Don't leave your profits to chance. Historically, this stock follows specific seasonal patterns that institutional traders use to maximize returns.
- ✅ Identify the "Golden Buying Window"
- ✅ Avoid high-risk correction cycles
- ✅ Backtested data from the last 20+ years