
May 31, 2026 a 03:15 pm
HAL: Fibonacci Analysis - Halliburton Company
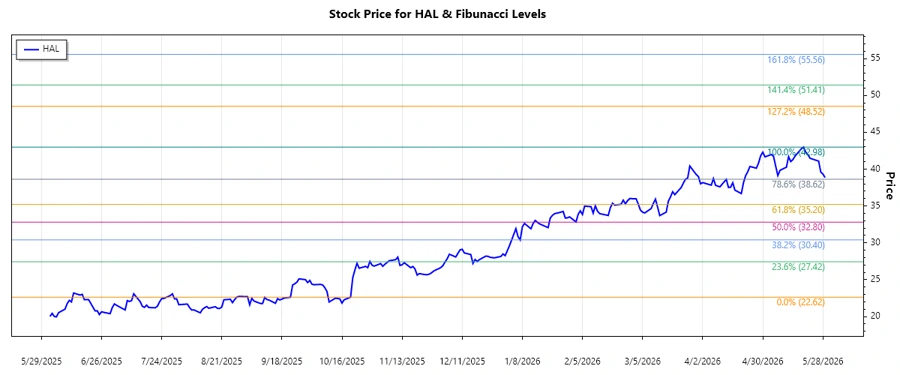
The Halliburton Company (Ticker: HAL) has shown a strong performance in recent months. The stock has demonstrated a clear upward trend with significant gains from its recent low point. As a major player in the energy sector, Halliburton's stock is subject to market dynamics and geopolitical factors that influence energy prices. The technical indicators suggest potential trading opportunities as it approaches key resistance levels.
Fibonacci Analysis
| Detail | Information |
|---|---|
| Trend Start Date | 2025-10-20 |
| Trend End Date | 2026-05-19 |
| High Price | $42.98 on 2026-05-19 |
| Low Price | $22.62 on 2025-10-20 |
| Fibonacci Level | Price Level |
|---|---|
| 0.236 | $27.13 |
| 0.382 | $30.42 |
| 0.500 | $32.80 |
| 0.618 | $35.19 |
| 0.786 | $39.42 |
The current price of $38.85 on 2026-05-29 is within the retracement zone of 0.786, indicating that the stock is potentially finding resistance near this level. This suggests that traders should watch for a reversal pattern or breakthrough at this price point, as it may indicate further bullish momentum or a pullback.
Conclusion
In conclusion, Halliburton Company's stock has been on a significant upward trajectory, with an impressive recovery since its October 2025 low. The Fibonacci Retracement levels provide insight into potential support and resistance areas, crucial for traders looking to make informed decisions. While the current position at the 0.786 retracement may indicate short-term resistance, a breakthrough might signify continued bullish growth. Conversely, failure to surpass this level could lead to a pullback. Analysts should monitor economic indicators and market trends in the energy sector to gauge potential risks and opportunities.
Smart Data Insight
Master the Perfect Entry & Exit for this Stock
Don't leave your profits to chance. Historically, this stock follows specific seasonal patterns that institutional traders use to maximize returns.
- ✅ Identify the "Golden Buying Window"
- ✅ Avoid high-risk correction cycles
- ✅ Backtested data from the last 20+ years