July 06, 2025 a 10:15 amHAL: Fibonacci Analysis - Halliburton Company
Analyzing the historical price data of Halliburton Company, it becomes evident that the stock has experienced a noticeable downtrend over the recent months. This trend represents potential opportunities for investors to analyze critical levels where price might retrace before continuing its downward movement or reversing. In this context, we apply Fibonacci Retracement levels to identify key price points that may act as support or resistance in the near future.
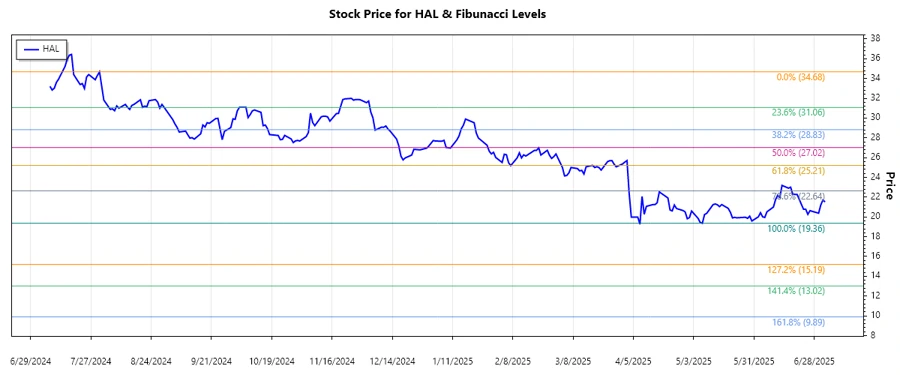
The recent performance of Halliburton's stock indicates a predominant downward trend, starting from a high of $34.68 on July 31, 2024, to a low of $19.36 on May 7, 2025. This has been a significant decline which opens avenues for technical analysis using Fibonacci Retracement to pinpoint potential recovery levels or further declines.
Fibonacci Analysis
The analysis of Halliburton's recent stock performance reveals a descending trend from a high of $34.68 on July 31, 2024, to a low of $19.36 on May 7, 2025. Using these points, Fibonacci retracement levels are calculated to anticipate potential reversal or continuation levels.
| Start Date | End Date | High Price | Low Price | Current Price |
|---|---|---|---|---|
| 2024-07-31 | 2025-05-07 | $34.68 (2024-07-31) | $19.36 (2025-05-07) | $21.52 (2025-07-03) |
Fibonacci Retracement Levels:
| Level | Price |
|---|---|
| 0.236 | $23.80 |
| 0.382 | $26.00 |
| 0.500 | $27.52 |
| 0.618 | $29.05 |
| 0.786 | $31.03 |
The current price of $21.52 suggests that the stock is trading below the lowest Fibonacci retracement level of 0.236, indicating a strong downward movement with no immediate signs of reversal.
Technically, these levels may serve as potential support and resistance. A breach and hold above the 0.236 level at $23.80 may suggest a short-term recovery, whereas failure to rise above this could lead to further declines.
Conclusion
The technical analysis of Halliburton Company's stock illustrates a significant bearish trend with a substantial decline from July 2024 to May 2025. While potential retracement zones are identified, the current price remains below the minimum retracement point, suggesting ongoing selling pressure or consolidation. Investors should watch for a close above the $23.80 level as a potential sign of recovery, thereby converting this technical indicator into a bullish opportunity. Conversely, failure to break above lower Fibonacci levels could retain bearish market sentiment, cautioning investors of continuous downtrend risks.
Smart Data Insight
Master the Perfect Entry & Exit for this Stock
Don't leave your profits to chance. Historically, this stock follows specific seasonal patterns that institutional traders use to maximize returns.
- ✅ Identify the "Golden Buying Window"
- ✅ Avoid high-risk correction cycles
- ✅ Backtested data from the last 20+ years