
July 25, 2026 a 07:46 am

HAL: Dividend Analysis - Halliburton Company
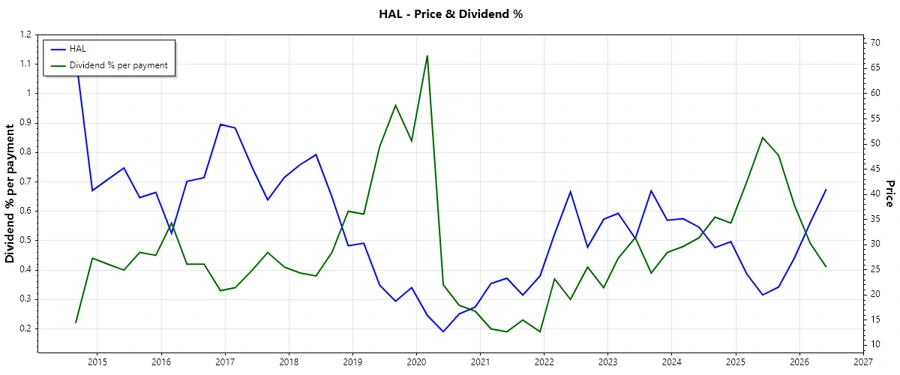
Halliburton Company, operating within the energy sector, has shown a consistent dividend profile over the years. With a dividend yield of 1.657%, the company continues to appeal to dividend-focused investors. Despite maintaining a moderate growth in dividends, the firm's historical consistency and stable payout ratios underscore its potential as a long-term dividend stock.
Overview
Halliburton Company operates within the competitive energy sector. The firm's current dividend yield stands at 1.657%. With a current dividend per share of $0.69 and an impressive dividend history spanning 42 years without any recent cuts or suspensions, Halliburton presents itself as a stable dividend-like stock.
| Data Point | Details |
|---|---|
| Sector | Energy |
| Dividend yield | 1.657% |
| Current dividend per share | $0.69 |
| Dividend history | 42 years |
| Last cut or suspension | None |
Dividend History
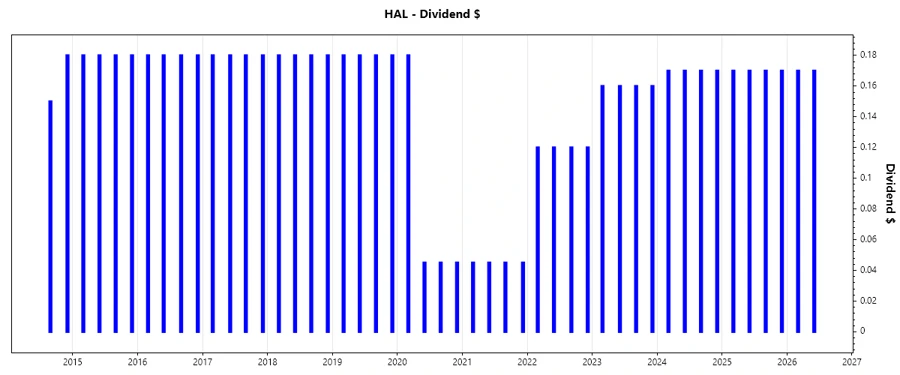
The significance of an extended dividend history serves to highlight both reliability and shareholder commitment. This track record is critical for investors targeting stable, long-term income.
| Year | Dividend per share (USD) |
|---|---|
| 2026 | 0.34 |
| 2025 | 0.68 |
| 2024 | 0.68 |
| 2023 | 0.64 |
| 2022 | 0.48 |
Dividend Growth
Sustainable growth in dividends is a key indicator of a company’s underlying profitability and commitment to shareholders.
| Time | Growth |
|---|---|
| 3 years | 12.31% |
| 5 years | 16.64% |
The average dividend growth is 16.64% over 5 years. This indicates moderate but steady dividend growth.
Payout Ratio
The payout ratio connects a company’s retained earnings with its dividend payments. A sustainable payout ratio is pivotal for ongoing dividend stability.
| Key figure | Ratio |
|---|---|
| EPS-based | 36.01% |
| Free cash flow-based | 33.42% |
A payout ratio of 36.01% (EPS) and 33.42% (FCF) indicates a healthy and sustainable dividend, allowing for future growth and reinvestment.
Cashflow & Capital Efficiency
Effective cash flow management and capital efficiency are crucial for sustaining dividend payouts and evaluating the company’s financial health.
| Metric | 2023 | 2024 | 2025 |
|---|---|---|---|
| Free Cash Flow Yield | 6.40% | 10.10% | 7.051% |
| Earnings Yield | 8.11% | 10.42% | 5.41% |
| CAPEX to Operating Cash Flow | 39.88% | 37.31% | 42.86% |
| Stock-based Compensation to Revenue | 0% | 0% | 0% |
| Free Cash Flow / Operating Cash Flow Ratio | 60.12% | 37.31% | 57.14% |
These figures suggest solid cash flow performance and capital efficiency, highlighting a robust foundation for dividend sustainability.
Balance Sheet & Leverage Analysis
Analyzing the balance sheet provides insight into the company's financial stability and leverage, which is crucial for ongoing dividend health.
| Metric | 2023 | 2024 | 2025 |
|---|---|---|---|
| Debt-to-Equity | 0.94 | 0.83 | 0.78 |
| Debt-to-Assets | 0.36 | 0.34 | 0.33 |
| Debt-to-Capital | 0.48 | 0.46 | 0.44 |
| Net Debt to EBITDA | 1.33 | 1.23 | 1.44 |
| Current Ratio | 2.06 | 2.05 | 2.04 |
| Quick Ratio | 1.48 | 1.54 | 1.50 |
| Financial Leverage | 2.63 | 2.43 | 2.39 |
The company's balance sheet metrics reveal manageable debt levels and strong liquidity, indicating financial stability.
Fundamental Strength & Profitability
Reviewing fundamental and profitability metrics provides insight into the company’s operational performance and long-term sustainability.
| Metric | 2023 | 2024 | 2025 |
|---|---|---|---|
| Return on Equity | 28.09% | 23.81% | 12.26% |
| Return on Assets | 10.69% | 9.77% | 5.13% |
| Gross Margin | 18.94% | 18.75% | 15.71% |
| EBIT Margin | 17.12% | 17.11% | 13.46% |
| EBITDA Margin | 21.46% | 21.81% | 18.58% |
| Net Margin | 11.46% | 10.90% | 5.78% |
| R&D to Revenue | 1.77% | 1.85% | 1.85% |
With robust profit margins and respectable returns, Halliburton demonstrates strong fundamental soundness and profitability.
Price Development
Dividend Scoring System
| Criterion | Points | Score Bar |
|---|---|---|
| Dividend yield | 3 | |
| Dividend Stability | 5 | |
| Dividend growth | 4 | |
| Payout ratio | 4 | |
| Financial stability | 4 | |
| Dividend continuity | 5 | |
| Cashflow Coverage | 4 | |
| Balance Sheet Quality | 4 |
Overall Score: 33 out of 40
Rating
Based on a comprehensive evaluation of Halliburton’s dividend profile, the company is recommended for investors looking for reliable dividend payouts with moderate growth potential. Its strong dividend history, steady payout ratios, and robust financials support the case for a “Buy” rating in the dividend growth quadrant.
Smart Data Insight
Master the Perfect Entry & Exit for this Stock
Don't leave your profits to chance. Historically, this stock follows specific seasonal patterns that institutional traders use to maximize returns.
- ✅ Identify the "Golden Buying Window"
- ✅ Avoid high-risk correction cycles
- ✅ Backtested data from the last 20+ years