
June 19, 2026 a 12:46 pm
📊 HAL: Dividend Analysis - Halliburton Company
Halliburton Company demonstrates a commendable dividend profile with a dividend yield of 1.66%. Its solid dividend history of 42 years without recent cuts underscores its commitment to shareholders. However, the moderate growth suggests a cautious approach, presenting a stable yet conservative dividend strategy.
Overview
As a leading player in the Energy sector, Halliburton Company has built a reputation for delivering consistent shareholder value. The current dividend yield stands at 1.66%, with a dividend per share of 0.69 USD. With 42 years of dividend history and no recent cuts, Halliburton underscores stability and reliability, key factors for income-focused investors.
| Detail | Data |
|---|---|
| Sector | Energy |
| Dividend yield | 1.66% |
| Current dividend per share | 0.69 USD |
| Dividend history | 42 years |
| Last cut or suspension | None |
Dividend History
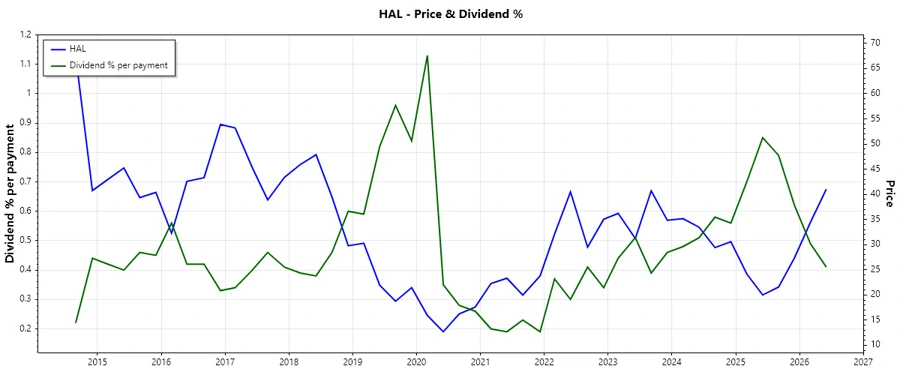
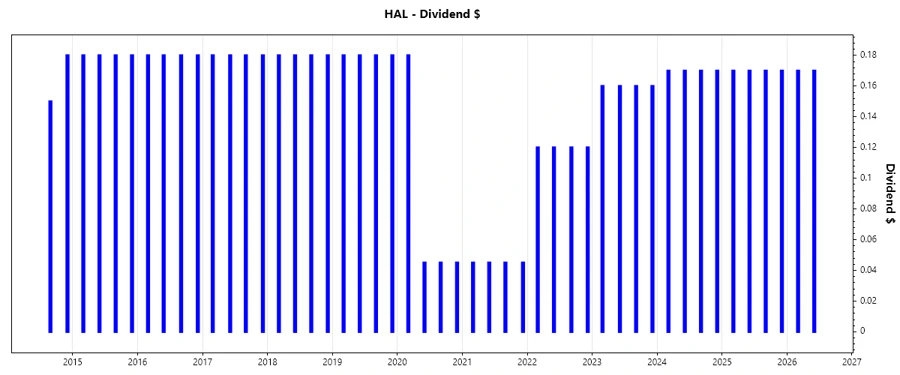
The dividend history reveals Halliburton's unwavering commitment to its dividend policy, an indicator of strong financial health and consistent cash flow generation. Investors value this stability, which helps in portfolio planning and income generation.
| Year | Dividend per Share (USD) |
|---|---|
| 2026 | 0.34 |
| 2025 | 0.68 |
| 2024 | 0.68 |
| 2023 | 0.64 |
| 2022 | 0.48 |
Dividend Growth
Examining the dividend growth offers insight into Halliburton's ability to enhance shareholder returns. Over the past 3 years, growth has been subtle at 12.31%, indicating stable management practices. However, the 5-year growth at 16.64% is a testament to the company's strategic focus on value creation.
| Time | Growth |
|---|---|
| 3 years | 12.31% |
| 5 years | 16.64% |
The average dividend growth is 16.64% over 5 years. This shows moderate but steady dividend growth, reflecting Halliburton's commitment to increasing shareholder returns.
Payout Ratio
The payout ratios highlight Halliburton's balanced approach towards dividend distributions. With an EPS-based payout ratio of 37.51% and an FCF-based ratio of 34.36%, the company maintains dividends well within earnings and cash flows, indicating sustained payout capability while retaining capital for growth and stability.
| Key figure | Ratio |
|---|---|
| EPS-based | 37.51% |
| Free cash flow-based | 34.36% |
These payout ratios are indicative of a sustainable dividend policy, ensuring that earnings and cash flows sufficiently cover the dividends, allowing for potential increases in the future.
Cashflow & Capital Efficiency
A deeper dive into cashflow metrics reveals Halliburton's efficient capital usage. The robust free cash flow yield and favorable earnings yield alongside a moderate Capex to Operating Cash flow ratio shed light on the firm's adept operational efficiency, ensuring sufficient cash absorption for dividends and growth initiatives.
| 2023 | 2024 | 2025 | |
|---|---|---|---|
| Free Cash Flow Yield | 5.75% | 10.10% | 7.05% |
| Earnings Yield | 8.12% | 10.43% | 5.41% |
| CAPEX to Operating Cash Flow | 39.88% | 37.31% | 42.86% |
| Stock-based Compensation to Revenue | - | - | - |
| Free Cash Flow / Operating Cash Flow Ratio | 57.14% | 62.69% | 57.14% |
Overall, Halliburton displays strong cashflow stability and capital efficiency, evident from its high FCF yield and manageable capital expenditures, supporting both operational needs and investor returns.
Balance Sheet & Leverage Analysis
Analyzing leverage metrics provides an insight into Halliburton's balance sheet robustness. The predictable leverage ratios such as Debt-to-Equity and Net Debt to EBITDA ratios are within healthy thresholds, indicating prudent financial management and a well-structured debt profile.
| 2023 | 2024 | 2025 | |
|---|---|---|---|
| Debt-to-Equity | 0.94 | 0.83 | 0.78 |
| Debt-to-Assets | 35.69% | 34.28% | 32.52% |
| Debt-to-Capital | 48.40% | 45.50% | 43.74% |
| Net Debt to EBITDA | 1.33 | 1.23 | 1.44 |
| Current Ratio | 2.06 | 2.05 | 2.04 |
| Quick Ratio | 1.48 | 1.54 | 1.51 |
| Financial Leverage | 2.63 | 2.44 | 2.39 |
Halliburton's balance sheet suggests a well-managed leverage strategy enabling adequate liquidity for operations and potential for leveraging strategic growth opportunities.
Fundamental Strength & Profitability
Fundamental strength metrics reflect Halliburton's profitability health. Strong returns such as ROE and ROIC, combined with healthy profit margins, illustrate efficiency in utilizing equity and capital while maximizing revenue and profits.
| 2023 | 2024 | 2025 | |
|---|---|---|---|
| Return on Equity | 28.09% | 23.81% | 12.26% |
| Return on Assets | 10.69% | 9.77% | 5.13% |
| Margins: Net | 11.46% | 10.90% | 5.78% |
| Margins: EBIT | 17.12% | 17.11% | 13.46% |
| Margins: EBITDA | 21.43% | 21.81% | 18.58% |
| Margins: Gross | 18.94% | 18.75% | 15.71% |
| Research & Development to Revenue | 1.77% | 1.86% | 1.85% |
The metrics indicate Halliburton's sound profitability state, reflecting effective management and operational strategies aligning with long-term shareholder value enhancement.
Price Development
Dividend Scoring System
| Criteria | Score | Score Bar |
|---|---|---|
| Dividend yield | 3 | |
| Dividend Stability | 5 | |
| Dividend growth | 3 | |
| Payout ratio | 4 | |
| Financial stability | 5 | |
| Dividend continuity | 5 | |
| Cashflow Coverage | 4 | |
| Balance Sheet Quality | 4 |
Overall Score: 33/40
Rating
In conclusion, Halliburton Company offers a solid dividend proposition with a dependable track record of distributions and a commendable stability profile, making it a suitable candidate for conservative, income-focused portfolios. While growth is moderate, the company's strong balance sheet and financial stability provide a secure environment for dividends to continue flowing, reinforcing it as a reliable income investment option.
Smart Data Insight
Master the Perfect Entry & Exit for this Stock
Don't leave your profits to chance. Historically, this stock follows specific seasonal patterns that institutional traders use to maximize returns.
- ✅ Identify the "Golden Buying Window"
- ✅ Avoid high-risk correction cycles
- ✅ Backtested data from the last 20+ years