May 08, 2026 a 11:31 am
HAL: Dividend Analysis - Halliburton Company
Halliburton Company is recognized for its robust dividend history, demonstrating a consistent payout strategy over 42 years. With a current dividend yield of 1.97%, the company provides a modest return compared to industry standards. Despite some fluctuations, the company maintains its commitment to shareholder returns through dividends.
📊 Overview
As a leading entity in the energy sector, Halliburton Company offers a dividend yield of 1.97% with a current dividend of 0.69 USD per share. The company's impressive 42-year dividend history underscores its commitment to shareholder value. Notably, the company has not experienced any recent dividend cuts or suspensions, signaling stability.
| Sector | Dividend Yield (%) | Current Dividend per Share (USD) | Dividend History (Years) | Last Cut or Suspension |
|---|---|---|---|---|
| Energy | 1.97 | 0.69 | 42 | None |
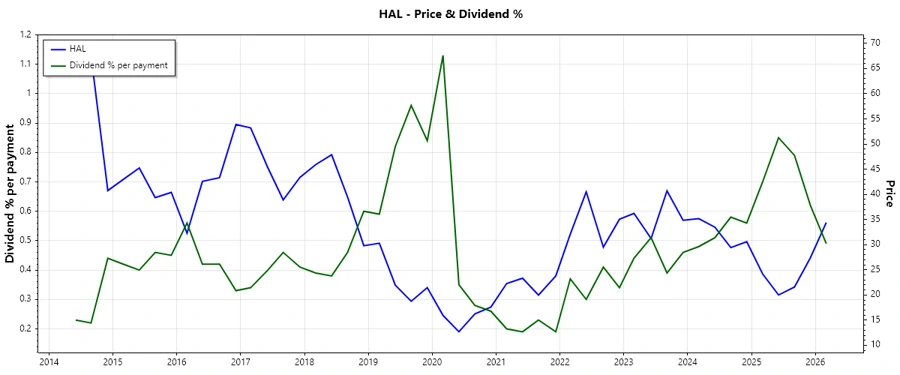
🗣️ Dividend History
Halliburton has a rich dividend history, crucial for assessing its reliability in maintaining payouts. A dependable history is often indicative of financial soundness and company commitment to shareholders. This historical consistency is a key consideration for long-term investment strategies.
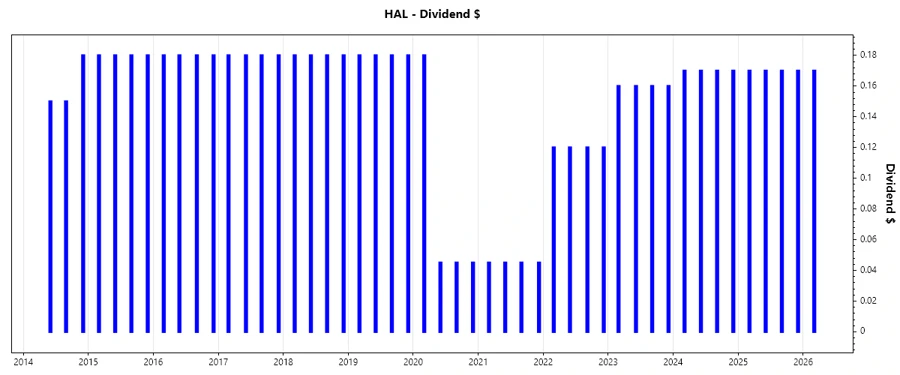
| Year | Dividend per Share (USD) |
|---|---|
| 2026 | 0.17 |
| 2025 | 0.68 |
| 2024 | 0.68 |
| 2023 | 0.64 |
| 2022 | 0.48 |
📈 Dividend Growth
Dividend growth analysis is vital as it indicates the potential for increasing returns. Over the last 3 years, Halliburton's dividends grew by 12.31%, and by 16.64% over the last 5 years. Such growth rates are indicative of strong cash flow and earnings growth potential.
| Time | Growth (%) |
|---|---|
| 3 years | 12.31 |
| 5 years | 16.64 |
The average dividend growth is 16.64% over 5 years. This demonstrates moderate but steady dividend growth.
📉 Payout Ratio
A payout ratio analysis reveals the proportion of earnings paid as dividends, indicating sustainability. Halliburton's EPS-based payout ratio is 37.51%, and its free cash flow-based payout ratio is 34.36%. These figures suggest that the company retains a significant portion of profits, providing room for future growth.
| Key Figure | Ratio (%) |
|---|---|
| EPS-based | 37.51 |
| Free Cash Flow-based | 34.36 |
The payout ratios for EPS and FCF are healthy, supporting the sustainability of the company's dividend strategy.
💰 Cashflow & Capital Efficiency
Cashflow stability and efficient capital use are critical indicators of a company's operational health. Metrics such as free cash flow yield and earnings yield demonstrate Halliburton's ability to generate cash and provide shareholder returns.
| Year | 2023 | 2024 | 2025 |
|---|---|---|---|
| Free Cash Flow Yield | 6.40% | 10.10% | 7.05% |
| Earnings Yield | 8.12% | 10.43% | 5.41% |
| CAPEX to Operating Cash Flow | 0.40 | 0.37 | 0.43 |
| Stock-based Compensation to Revenue | 0% | 0% | 0% |
| Free Cash Flow / Operating Cash Flow Ratio | 0.60 | 0.63 | 0.57 |
| Return on Invested Capital | 16.71% | 14.70% | 8.38% |
Overall, Halliburton shows solid cashflow stability, with effective capital returns reflected in its comprehensive metrics.
📜 Balance Sheet & Leverage Analysis
The balance sheet reveals Halliburton's financial foundation, assessing liquidity and leverage. Ratios such as debt-to-equity and debt-to-assets indicate financial health and ability to manage obligations.
| Year | 2023 | 2024 | 2025 |
|---|---|---|---|
| Debt-to-Equity | 0.94 | 0.83 | 0.78 |
| Debt-to-Assets | 0.36 | 0.34 | 0.33 |
| Debt-to-Capital | 0.48 | 0.46 | 0.44 |
| Net Debt to EBITDA | 1.29 | 1.23 | 1.44 |
| Current Ratio | 2.06 | 2.05 | 2.04 |
| Quick Ratio | 1.48 | 1.54 | 1.51 |
| Financial Leverage | 2.63 | 2.44 | 2.39 |
Halliburton's balance sheet demonstrates stable leverage and a strong financial position, capable of withstanding economic fluctuations.
📈 Fundamental Strength & Profitability
Fundamental metrics highlight Halliburton's profit-generating capacity and operational efficiency. These indicators provide insight into the company's core performance capabilities.
| Year | 2023 | 2024 | 2025 |
|---|---|---|---|
| Return on Equity | 28.09% | 23.81% | 12.26% |
| Return on Assets | 10.69% | 9.77% | 5.13% |
| Net Margin | 11.46% | 10.90% | 5.78% |
| EBIT Margin | 17.74% | 17.11% | 13.46% |
| EBITDA Margin | 22.07% | 21.81% | 18.58% |
| Gross Margin | 18.94% | 18.75% | 15.70% |
| R&D to Revenue | 1.77% | 1.85% | 1.85% |
Robust profitability metrics position Halliburton as an efficiently managed company, with significant potential for sustained growth and success.
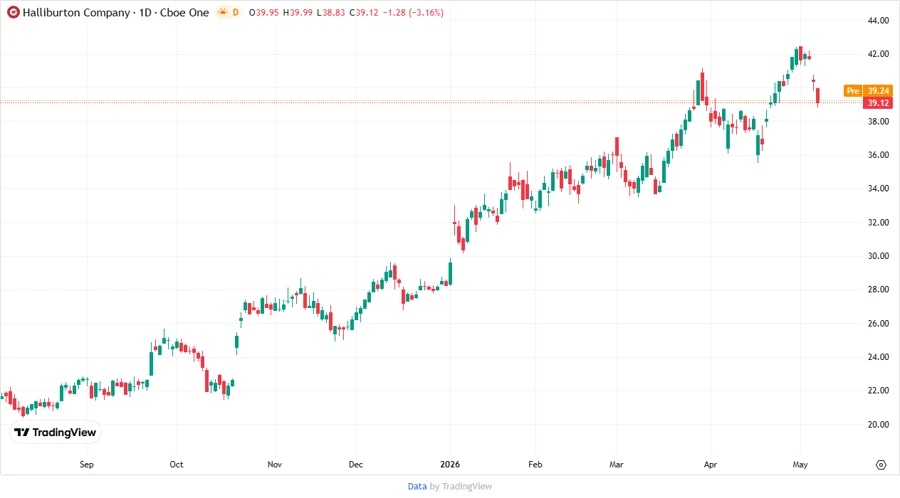
🚀 Price Development
✅ Dividend Scoring System
| Criteria | Score | Score Bar |
|---|---|---|
| Dividend Yield | 3 | |
| Dividend Stability | 4 | |
| Dividend Growth | 4 | |
| Payout Ratio | 4 | |
| Financial Stability | 4 | |
| Dividend Continuity | 5 | |
| Cashflow Coverage | 4 | |
| Balance Sheet Quality | 4 |
Total Score: 32/40
🗳️ Rating
Halliburton Company presents a solid investment opportunity for those seeking stable dividend income with moderate growth potential. The company's strong financial metrics, coupled with a long-standing history of dividend payments, provide reassurance of its ongoing commitment to returning value to shareholders. However, potential investors should consider the moderate yield in comparison to other market opportunities.
Smart Data Insight
Master the Perfect Entry & Exit for this Stock
Don't leave your profits to chance. Historically, this stock follows specific seasonal patterns that institutional traders use to maximize returns.
- ✅ Identify the "Golden Buying Window"
- ✅ Avoid high-risk correction cycles
- ✅ Backtested data from the last 20+ years