February 23, 2026 a 12:46 pm

HAL: Dividend Analysis - Halliburton Company
Halliburton Company demonstrates a promising dividend profile with a substantial history of payouts, encapsulating a robust 55-year track record. Despite the modest dividend yield, the company's strong earnings and cash flow metrics support sustainable dividend distributions. The consistent but moderate growth in dividends over the last 5 years reflects a strategic commitment to returning value to shareholders.
📊 Overview
Halliburton operates within the energy sector and exhibits a commendable dividend yield for a company of its calibre. The firm has maintained a consistent dividend history over 55 years, demonstrating strong commitment and reliability. With a current dividend per share of $0.69 USD, this continuity is underlined by the absence of recent dividend cuts.
| Metric | Value |
|---|---|
| Sector | Energy |
| Dividend Yield | 1.94 % |
| Current Dividend per Share | $0.69 USD |
| Dividend History | 55 years |
| Last Cut or Suspension | None |
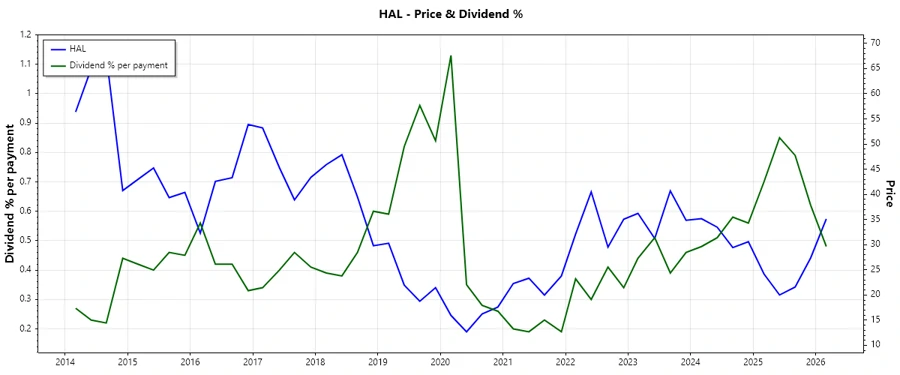
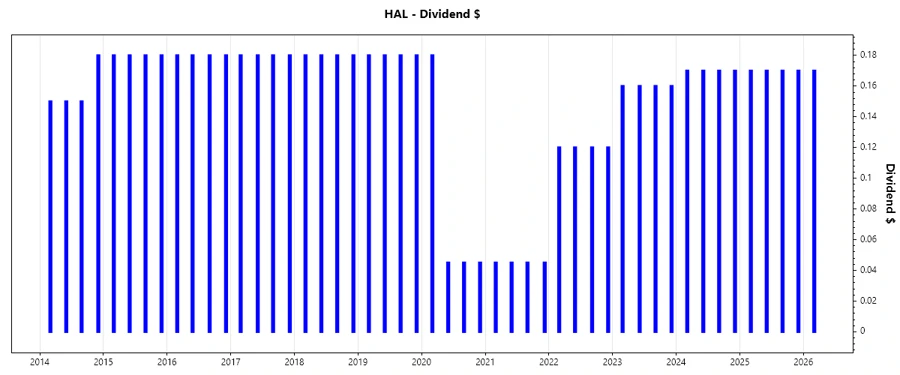
🗣️ Dividend History
The dividend history of Halliburton is a testament to its resilience and shareholder value-focused culture. Historical patterns reveal stability in dividend payments, crucial for income-focused investors. This consistency builds trust and signals financial robustness during market fluctuations.
| Year | Dividend per Share (USD) |
|---|---|
| 2026 | 0.17 |
| 2025 | 0.68 |
| 2024 | 0.68 |
| 2023 | 0.64 |
| 2022 | 0.48 |
📈 Dividend Growth
Growth metrics reveal incremental but consistent increases in dividends, echoing strong financial performance. Steady growth over 3 and 5 years indicates strategic foresight and financial strength, addressing future market demands.
| Time | Growth |
|---|---|
| 3 years | 12.31 % |
| 5 years | 16.64 % |
The average dividend growth is 16.64 % over 5 years. This shows moderate but steady dividend growth.
⚠️ Payout Ratio
Payout ratios are crucial for understanding dividend sustainability. Halliburton maintains a disciplined payout with a 45.13 % EPS-based and a 34.74 % Free Cash Flow-based ratio. This balance highlights a prudent approach to both rewarding shareholders and investing in future growth.
| Key figure | Ratio |
|---|---|
| EPS-based | 45.13 % |
| Free cash flow-based | 34.74 % |
💵 Cashflow & Capital Efficiency
Cash flow and capital efficiency metrics reflect Halliburton's robust handling of capital, demonstrating healthy Free Cash Flow and Earnings Yield. These indicators support its ability to maintain dividends, manage operations, and invest in growth opportunities.
| Metric | 2023 | 2024 | 2025 |
|---|---|---|---|
| Free Cash Flow Yield | 6.40 % | 10.10 % | 7.05 % |
| Earnings Yield | 8.12 % | 10.43 % | 5.41 % |
| CAPEX to Operating Cash Flow | 0.40 % | 0.37 % | 0.43 % |
| Stock-based Compensation to Revenue | 0 % | 0 % | 0 % |
| Free Cash Flow / Operating Cash Flow Ratio | 60.12 % | 62.69 % | 57.14 % |
📊 Balance Sheet & Leverage Analysis
Analyzing the balance sheet metrics reveals Halliburton's solid financial structure with manageable debt levels. The Debt-to-Equity and Debt-to-Assets ratios highlight a stable leverage stance, while high interest coverage ensures resilience against borrowing costs.
| Metric | 2023 | 2024 | 2025 |
|---|---|---|---|
| Debt-to-Equity | 0.94 | 0.83 | 0.78 |
| Debt-to-Assets | 0.36 | 0.34 | 0.33 |
| Debt-to-Capital | 0.48 | 0.46 | 0.44 |
| Net Debt to EBITDA | 1.325 | 1.292 | 1.952 |
| Current Ratio | 2.06 | 2.05 | 2.04 |
| Quick Ratio | 1.48 | 1.54 | 1.51 |
| Financial Leverage | 2.63 | 2.44 | 2.39 |
📈 Fundamental Strength & Profitability
Examining key profitability metrics, Halliburton exhibits strong Returns on Equity and Assets, underpinned by healthy profit margins. These indicators underscore substantial earnings power and operational efficiency, ensuring their competitive advantage in the sector.
| Metric | 2023 | 2024 | 2025 |
|---|---|---|---|
| Return on Equity | 28.09 % | 23.81 % | 12.26 % |
| Return on Assets | 10.69 % | 9.77 % | 5.13 % |
| Net Margin | 11.46 % | 10.90 % | 5.78 % |
| EBIT Margin | 17.12 % | 16.06 % | 9.88 % |
| EBITDA Margin | 21.46 % | 20.76 % | 13.69 % |
| Gross Margin | 18.94 % | 18.75 % | 15.76 % |
| Research & Development to Revenue | 0 % | 0 % | 0 % |
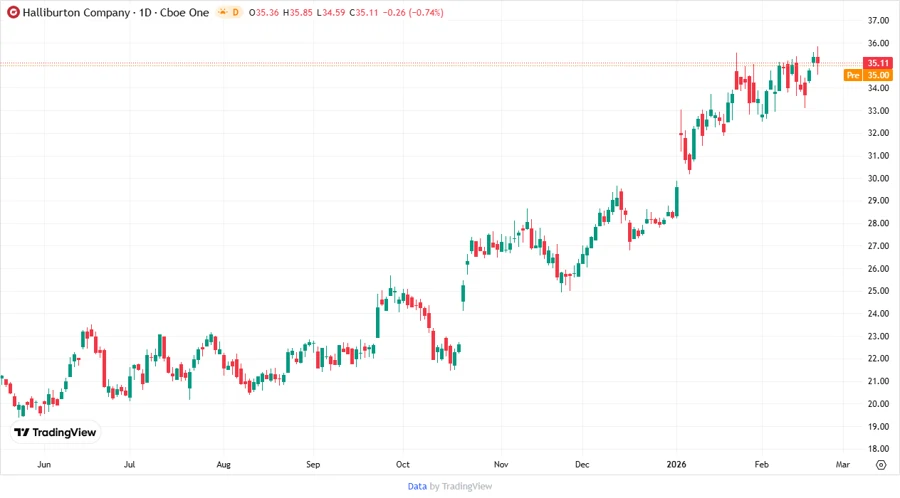
📉 Price Development
✅ Dividend Scoring System
| Category | Score | Score Bar |
|---|---|---|
| Dividend yield | 4 | |
| Dividend Stability | 5 | |
| Dividend Growth | 4 | |
| Payout Ratio | 4 | |
| Financial Stability | 5 | |
| Dividend Continuity | 5 | |
| Cashflow Coverage | 4 | |
| Balance Sheet Quality | 4 |
Overall score: 35/40
🗣️ Rating
Based on the comprehensive analysis, Halliburton Company presents a sound dividend profile characterized by longevity, stability, and moderate growth potential. Tactical management of payout ratios, coupled with strong financial health, makes it a viable option for income-focused portfolios.
Smart Data Insight
Master the Perfect Entry & Exit for this Stock
Don't leave your profits to chance. Historically, this stock follows specific seasonal patterns that institutional traders use to maximize returns.
- ✅ Identify the "Golden Buying Window"
- ✅ Avoid high-risk correction cycles
- ✅ Backtested data from the last 20+ years