November 19, 2025 a 12:47 pm

HAL: Dividend Analysis - Halliburton Company
Halliburton Company presents an intriguing dividend profile with a substantial history of dividend payments. Despite facing challenges in maintaining consistent growth, the company has proven its resilience over the years, demonstrating durability with a dividend history spanning over five decades. With a current dividend yield of 3.15%, Halliburton offers potential value to income-focused investors.
Overview 📊
Halliburton operates in the energy sector, holding consistent appeal for investors with its 54-year history of dividend issuance. The current dividend per share is 0.68 USD, translating into a yield of 3.15%. Historical resilience is notable, though recent growth rates are modest.
| Metric | Value |
|---|---|
| Sector | Energy |
| Dividend Yield | 3.15% |
| Current Dividend Per Share | 0.68 USD |
| Dividend History | 54 years |
| Last Cut or Suspension | None |
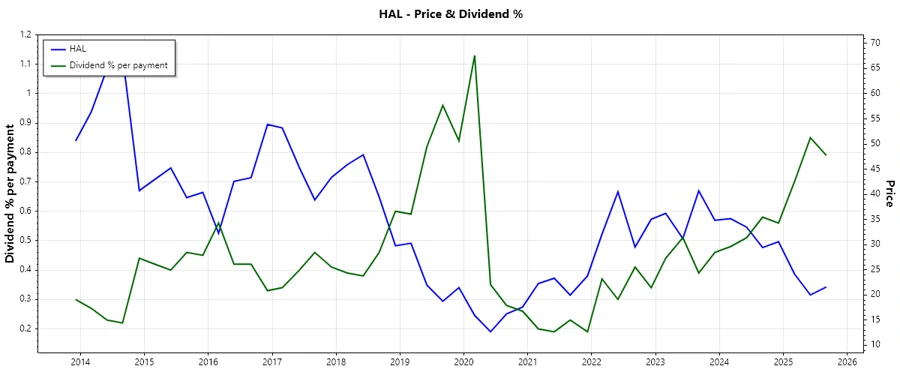
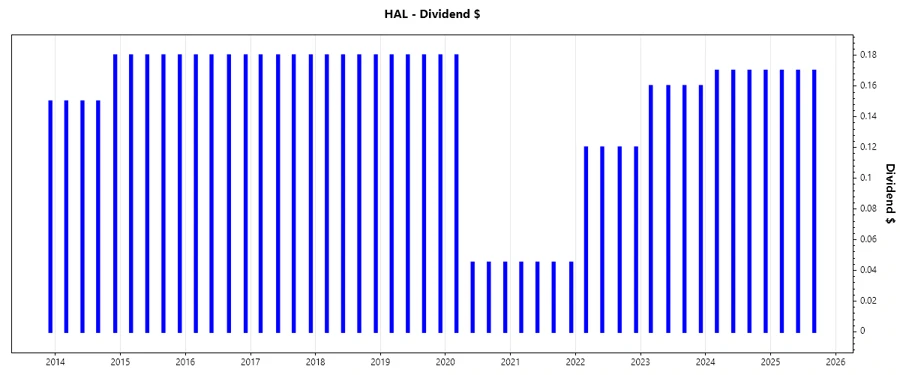
Dividend History 📈
The length of Halliburton’s dividend history showcases a commitment to returning value to shareholders. Consistent payments, despite market fluctuations, underscore the company’s financial robustness.
| Year | Dividend Per Share (USD) |
|---|---|
| 2025 | 0.51 |
| 2024 | 0.68 |
| 2023 | 0.64 |
| 2022 | 0.48 |
| 2021 | 0.18 |
Dividend Growth 📉
While dividend growth over the last 3 years shows a positive movement at 0.56%, the 5-year growth rate remains slightly negative. This suggests a recent focus on stabilizing dividends rather than aggressive growth.
| Time | Growth |
|---|---|
| 3 years | 0.56% |
| 5 years | -0.01% |
The average dividend growth is -0.01% over 5 years. This shows moderate but steady dividend growth.
Payout Ratio ✅
The payout ratio is a critical metric revealing how much of the company's earnings and free cash flow are distributed as dividends. Maintaining a balanced ratio ensures sustainable dividend policies without overstretching resources.
| Key Figure | Ratio |
|---|---|
| EPS-based | 44.54% |
| Free Cash Flow-based | 31.25% |
The current payout ratio of 44.54% (EPS) and 31.25% (FCF) indicates healthy dividend coverage, balancing shareholder returns with reinvestment capacity.
Cashflow & Capital Efficiency 💰
Effective cash flow management and capital efficiency are vital for sustaining operations and funding future growth without excessive leverage.
| Metric | 2024 | 2023 | 2022 |
|---|---|---|---|
| Free Cash Flow Yield | 10.10% | 6.40% | 3.46% |
| Earnings Yield | 10.43% | 8.12% | 4.42% |
| CAPEX to Operating Cash Flow | 37.31% | 39.88% | 45.09% |
| Stock-based Compensation to Revenue | 0% | 0% | 0% |
| Free Cash Flow / Operating Cash Flow Ratio | 62.69% | 60.12% | 54.91% |
The data reflects a robust cash flow management strategy, with a focus on maintaining healthy cash reserves and efficient capital allocation through proportional CAPEX expenditures.
Balance Sheet & Leverage Analysis 📊
A strong balance sheet is integral to withstanding market volatility and ensuring long-term financial health and agility.
| Metric | 2024 | 2023 | 2022 |
|---|---|---|---|
| Debt-to-Equity | 0.83 | 0.94 | 1.13 |
| Debt-to-Assets | 0.34 | 0.36 | 0.38 |
| Debt-to-Capital | 0.46 | 0.48 | 0.53 |
| Net Debt to EBITDA | 1.29 | 1.33 | 1.86 |
| Current Ratio | 2.05 | 2.06 | 2.05 |
| Quick Ratio | 1.54 | 1.48 | 1.50 |
| Financial Leverage | 2.44 | 2.63 | 2.93 |
Halliburton's leverage metrics indicate a progressive improvement in debt management, reducing dependency on external financing and enhancing financial flexibility.
Fundamental Strength & Profitability 🗣️
The company's fundamental health is gauged by profitability metrics which reflect operational efficiency and effectiveness in generating returns.
| Metric | 2024 | 2023 | 2022 |
|---|---|---|---|
| Return on Equity | 23.81% | 28.09% | 19.78% |
| Return on Assets | 9.77% | 10.69% | 6.76% |
| Gross Margin | 18.75% | 18.94% | 16.32% |
| EBIT Margin | 16.06% | 17.12% | 12.82% |
| EBITDA Margin | 20.76% | 21.46% | 17.45% |
| Net Profit Margin | 10.90% | 11.46% | 7.74% |
| R&D to Revenue | 0% | 0% | 0% |
Strong ROE and solid margins reflect excellent profitability and operational efficiency, reinforcing Halliburton's ability to generate shareholder value.
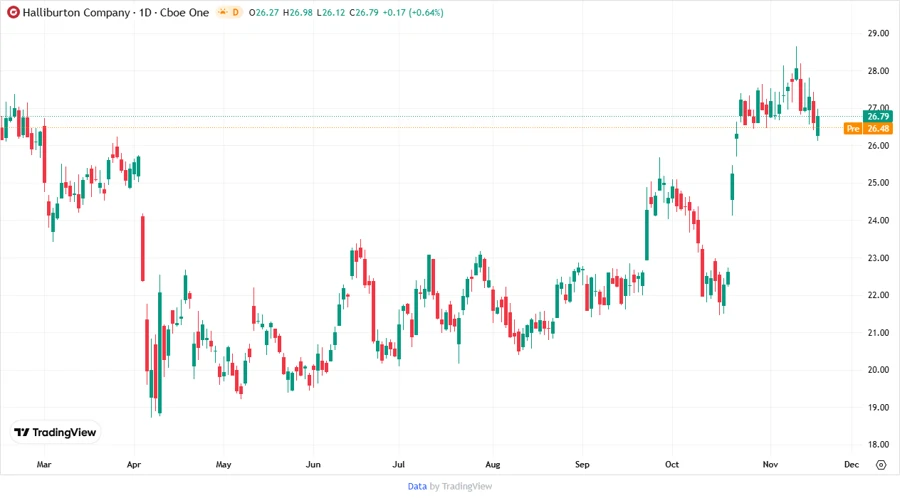
Price Development 📈
Dividend Scoring System 🌟
| Category | Score | Bar |
|---|---|---|
| Dividend Yield | 4 | |
| Dividend Stability | 5 | |
| Dividend Growth | 2 | |
| Payout Ratio | 4 | |
| Financial Stability | 4 | |
| Dividend Continuity | 5 | |
| Cashflow Coverage | 4 | |
| Balance Sheet Quality | 3 |
Total Score: 31/40
Rating 🔍
Based on the comprehensive analysis, Halliburton Company displays a solid dividend profile. With a high dividend stability score and reasonable payout ratios, it serves as a potentially lucrative investment for income-seeking portfolios. However, potential investors should weigh the modest growth prospects against their individual strategy and risk tolerance.