October 22, 2025 a 11:31 am

HAL: Dividend Analysis - Halliburton Company
Halliburton Company, a leader in the Energy Sector, has maintained a stable dividend distribution footprint across 54 years. Although the recent dividend yield of 3.15% is compelling, the company's historic decision to reduce dividends remains a key element for investor consideration. The balance between dividend yield and reinvestment holds crucial insights for stakeholders evaluating long-term value.
📊 Overview
Halliburton operates within a sector known for its cyclical nature, affecting dividend distributions. A yield of 3.15% suggests typical market alignment, complemented by a solid history of 54 years without notable cuts or suspensions. The current dividend stands at $0.68 per share.
| Detail | Value |
|---|---|
| Sector | Energy |
| Dividend Yield | 3.15% |
| Current Dividend per Share | 0.68 USD |
| Dividend History | 54 years |
| Last Cut or Suspension | None |
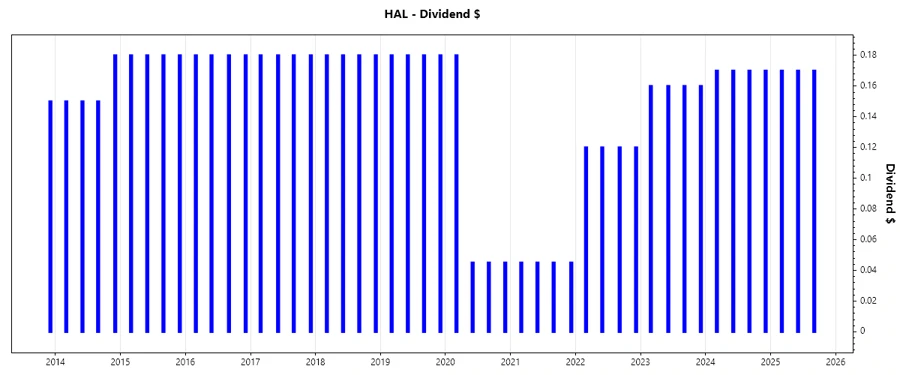
🗣️ Dividend History
Understanding the dividend history yields insights into corporate health and capital allocation priorities. A stable dividend signalizes sustained profitability through varied market conditions.
| Year | Dividend per Share (USD) |
|---|---|
| 2025 | 0.51 |
| 2024 | 0.68 |
| 2023 | 0.64 |
| 2022 | 0.48 |
| 2021 | 0.18 |
📈 Dividend Growth
Evaluated over a decade, dividend growth underscores a firm's adaptability and commitment to its shareholders amidst evolving macroeconomic conditions.
| Time | Growth |
|---|---|
| 3 years | 0.56% |
| 5 years | -0.01% |
The average dividend growth is -0.01% over 5 years. This shows moderate but steady dividend growth.
📉 Payout Ratio
Payout ratios reveal a company's dividend sustainability, balancing reinvestment needs and shareholder returns.
| Key Figure | Ratio |
|---|---|
| EPS-based | 44.47% |
| Free cash flow-based | 30.95% |
The EPS payout ratio at 44.47% indicates an acceptable balance, providing room for growth and reinvestment. The FCF payout ratio of 30.95% suggests efficient cash utilization.
✅ Cashflow & Capital Efficiency
Analyzing free cash and capital efficiency illustrates how effectively a firm finances its operations, reflecting its execution against strategic goals.
| Metric | 2024 | 2023 | 2022 |
|---|---|---|---|
| Free Cash Flow Yield | 10.10% | 6.40% | 3.46% |
| Earnings Yield | 10.43% | 8.12% | 4.42% |
| CAPEX to Operating Cash Flow | 0.37 | 0.40 | 0.45 |
| Stock-based Compensation to Revenue | 0.00 | 0.00 | 0.00 |
| Free Cash Flow / Operating Cash Flow Ratio | 62.69% | 60.12% | 54.91% |
The cash flow and capital efficiency metrics indicate robust cash generation with judicious capital application, enhancing financial resilience.
⚠️ Balance Sheet & Leverage Analysis
A balance sheet review identifies financial robustness, assessing whether the company can fulfill long-term financial obligations.
| Metric | 2024 | 2023 | 2022 |
|---|---|---|---|
| Debt-to-Equity | 0.835 | 0.938 | 1.125 |
| Debt-to-Assets | 0.343 | 0.357 | 0.385 |
| Debt-to-Capital | 0.455 | 0.484 | 0.529 |
| Net Debt to EBITDA | 1.29 | 1.35 | 1.86 |
| Current Ratio | 2.05 | 2.06 | 2.05 |
| Quick Ratio | 1.54 | 1.48 | 1.50 |
| Financial Leverage | 2.44 | 2.63 | 2.93 |
Financial stability is affirmed by a reducing debt-to-equity ratio and a stable leverage position, supporting operational scalability.
🔍 Fundamental Strength & Profitability
Profitability metrics and fundamental strengths evaluate managerial efficacy and market competitiveness.
| Metric | 2024 | 2023 | 2022 |
|---|---|---|---|
| Return on Equity | 23.81% | 28.09% | 19.78% |
| Return on Assets | 9.77% | 10.69% | 6.76% |
| Margins: Net | 10.90% | 11.46% | 7.74% |
| EBIT | 16.06% | 16.68% | 12.82% |
| EBITDA | 20.76% | 21.01% | 17.45% |
| Gross | 18.75% | 18.94% | 16.32% |
| R&D to Revenue | --- | 1.77% | --- |
Profitability improvements are consistent with higher return ratios and margins, highlighting competitive positioning and operational efficiency efforts.
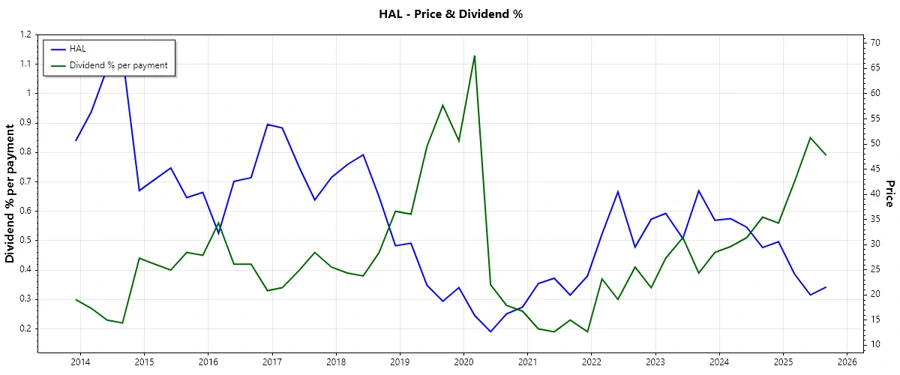
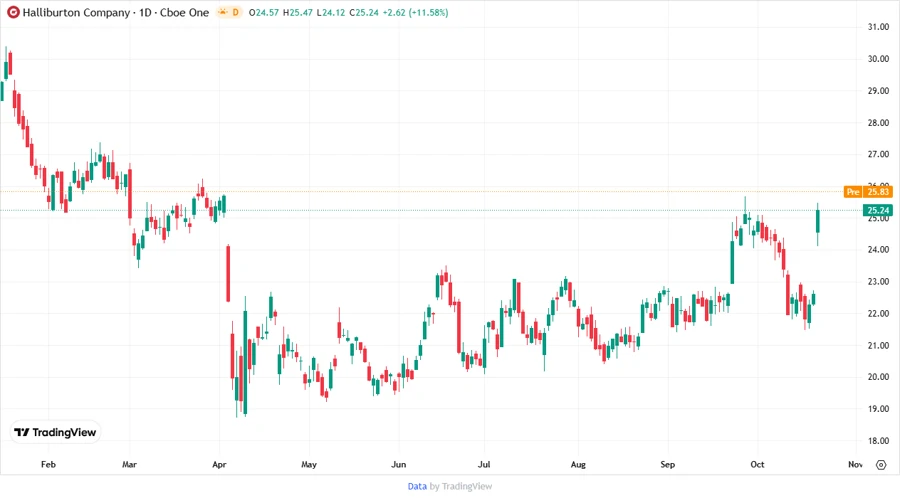
📊 Price Development
⭐ Dividend Scoring System
| Criteria | Score | Indicator |
|---|---|---|
| Dividend Yield | 3 | |
| Dividend Stability | 4 | |
| Dividend Growth | 2 | |
| Payout Ratio | 4 | |
| Financial Stability | 4 | |
| Dividend Continuity | 5 | |
| Cashflow Coverage | 3 | |
| Balance Sheet Quality | 4 |
Overall Score: 29/40 points
🗒️ Rating
Halliburton's consistent dividend history, coupled with robust financial metrics, suggests a balanced investment opportunity. While growth may be minimal, stability and strategic resource allocation position the firm advantageously for the foreseeable future. The recommendation remains cautiously optimistic for income-focused investors.
Smart Data Insight
Master the Perfect Entry & Exit for this Stock
Don't leave your profits to chance. Historically, this stock follows specific seasonal patterns that institutional traders use to maximize returns.
- ✅ Identify the "Golden Buying Window"
- ✅ Avoid high-risk correction cycles
- ✅ Backtested data from the last 20+ years