
July 14, 2026 a 03:15 am

GWW: Trend and Support & Resistance Analysis - W.W. Grainger, Inc.
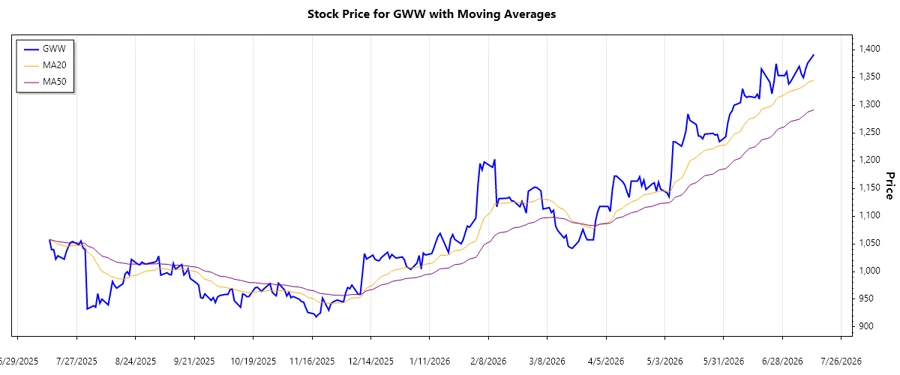
W.W. Grainger, Inc. has shown a significant uptrend in recent months, notably surpassing its resistance levels. The analysis of key indicators such as the EMA20 and EMA50 underscores a positive shift in market sentiment towards the stock. Investors should take note of the strong support zones, which suggest a sustained interest at current levels. However, potential resistance barriers could test this upwards momentum. As such, continuous monitoring of these levels is advised for stakeholders.
Trend Analysis
The stock price has demonstrated a consistent upward trajectory over the observed period. The calculation of the Exponential Moving Averages (EMA) over 20 and 50 days places the EMA20 above the EMA50, indicating an upward trend.
| Date | Close Price | Trend |
|---|---|---|
| 2026-07-13 | 1391.68 | ▲ |
| 2026-07-10 | 1375.76 | ▲ |
| 2026-07-09 | 1364.86 | ▲ |
| 2026-07-08 | 1349.74 | ▲ |
| 2026-07-07 | 1356.43 | ▲ |
| 2026-07-06 | 1370.16 | ▲ |
| 2026-07-02 | 1342.98 | ▲ |
Technical analysis affirms the ongoing bullish trend facilitated by strong investor confidence and supportive fundamentals.
Support and Resistance
Evaluating the price action, two major support and resistance zones have been identified. The stock is currently navigating above critical support levels.
| Zone Type | From | To |
|---|---|---|
| Support Zone 1 | 1290.00 | 1300.00 |
| Support Zone 2 | 1340.00 | 1350.00 |
| Resistance Zone 1 | 1400.00 | 1410.00 |
| Resistance Zone 2 | 1420.00 | 1430.00 |
The current price leans close to the upper resistance. Continued upward pressure may lead to a break above resistance, testing new highs.
Conclusion
The prevailing upward trend in W.W. Grainger, Inc.'s stock suggests potential for continued growth, contingent on surpassing resistance levels. Investors should remain alert to changes in market conditions that could affect this trajectory. While the defined support zones offer a safety net, any breach below could signal a need for reevaluation of strategies. Analysts will focus on these critical levels to determine future price action and maintain a balanced view that weighs both opportunities and inherent risks.
Smart Data Insight
Master the Perfect Entry & Exit for this Stock
Don't leave your profits to chance. Historically, this stock follows specific seasonal patterns that institutional traders use to maximize returns.
- ✅ Identify the "Golden Buying Window"
- ✅ Avoid high-risk correction cycles
- ✅ Backtested data from the last 20+ years