March 02, 2026 a 02:03 pm
GWW: Trend and Support & Resistance Analysis - W.W. Grainger, Inc.
W.W. Grainger, Inc., operating in the MRO sector, exhibits a significant stock performance with potential for strategic investment opportunities. The company's financial data suggests a recent fluctuation in trends, indicative of investor sentiment and broader market factors. Continued analysis is essential as the company operates internationally, which may expose it to varying economic conditions. Recent data indicate a complex but potentially advantageous position for stakeholders and potential investors.
Trend Analysis
| Date | Close Price | Trend |
|---|---|---|
| 2026-03-02 | 1142.41 | ▼ 🟥 |
| 2026-02-27 | 1144.73 | ▼ 🟥 |
| 2026-02-26 | 1105.52 | ▼ 🟥 |
| 2026-02-25 | 1117.18 | ▼ 🟥 |
| 2026-02-24 | 1126.68 | ▼ 🟥 |
| 2026-02-23 | 1116.75 | ▼ 🟥 |
| 2026-02-20 | 1127.07 | ▲ 🟩 |
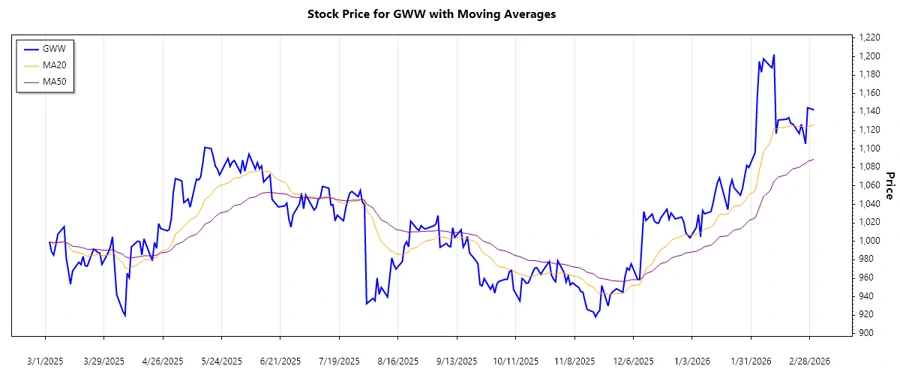
The calculated exponential moving averages (EMA) reveal a bearish sentiment with EMA20 consistently below EMA50, indicating a prevailing downtrend. This pattern suggests caution in the short term as further declines may be anticipated if the trend persists.
Support and Resistance
| Zone | From | To |
|---|---|---|
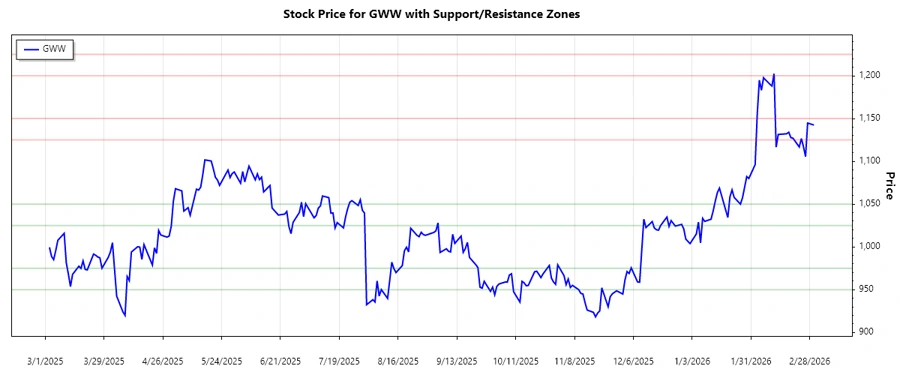
| Support | 1025 | 1050 |
| Support | 950 | 975 |
| Resistance | 1125 | 1150 |
| Resistance | 1200 | 1225 |
The current market price is precariously positioned between major support and resistance zones. The close of 1142.41 suggests the stock approaches the lower resistance level, where significant seller interest may inhibit further movement upwards.
Conclusion
Based on the analysis, W.W. Grainger, Inc. experiences a bearish trend in the market with prevalent resistance inhibiting an upward shift. While underlying market conditions may offer brief surges, caution is advised as potential downturns remain plausible. Investors should monitor geopolitical and economic contexts impacting international operations. Strong resistance levels have been identified, suggesting careful consideration before additional procurement. Fundamental analysis should accompany technical overviews for comprehensive insights.