June 27, 2026 a 07:31 am
GWW: Dividend Analysis - W.W. Grainger, Inc.
W.W. Grainger, Inc., a leading distributor of industrial supplies, showcases a robust dividend profile with a track record of consistent payouts. The company's solid market position is bolstered by its strategic dividend policy and financial discipline, making it a reliable choice for income-focused investors. Over the years, Grainger has demonstrated resilience in maintaining and growing its dividends, reflecting its commitment to shareholder value.
📊 Overview
Understanding the sectoral and financial backdrop of W.W. Grainger, Inc., gives insights into its dividend capabilities.
| Aspect | Detail |
|---|---|
| Sector | Industrials |
| Dividend yield | 0.76% |
| Current dividend per share | 9.75 USD |
| Dividend history | 42 years |
| Last cut or suspension | None |
🗣️ Dividend History
The stability and growth of dividends over time are crucial indicators of a company's financial health and commitment to shareholders.
| Year | Dividend Per Share (USD) |
|---|---|
| 2026 | 4.75 |
| 2025 | 8.83 |
| 2024 | 8.01 |
| 2023 | 7.30 |
| 2022 | 6.78 |
📈 Dividend Growth
Analyzing the dividend growth rate gives investors insights into the potential future payouts and company strategy.
| Time | Growth |
|---|---|
| 3 years | 9.21% |
| 5 years | 8.25% |
The average dividend growth is 8.25% over 5 years. This shows moderate but steady dividend growth.
⚠️ Payout Ratio
Monitoring payout ratios helps assess if a company can sustain its dividend payments without affecting its core operations.
| Key figure | Ratio |
|---|---|
| EPS-based | 25.88% |
| Free cash flow-based | 33.38% |
With an EPS payout ratio of 25.88% and a free cash flow payout ratio of 33.38%, Grainger's dividend payments appear sustainable with leeway for future growth.
✅ Cashflow & Capital Efficiency
Understanding cash flow dynamics and capital efficiency is essential for evaluating a company’s ability to fund its operations and future growth.
| Year | 2025 | 2024 | 2023 |
|---|---|---|---|
| Free Cash Flow Yield | 2.75% | 3.05% | 3.84% |
| Earnings Yield | 3.53% | 3.70% | 4.42% |
| CAPEX to Operating Cash Flow | 33.95% | 25.63% | 21.91% |
| Stock-based Compensation to Revenue | 0.36% | 0.36% | 0.38% |
| Free Cash Flow / Operating Cash Flow Ratio | 66.05% | 74.37% | 78.09% |
These metrics indicate a strong cash flow situation, providing Grainger with significant flexibility in managing its capital investments and operational requirements.
🎯 Balance Sheet & Leverage Analysis
A thorough review of leverage and liquidity ratios helps in understanding the financial resilience and risk profile of a company.
| Year | 2025 | 2024 | 2023 |
|---|---|---|---|
| Debt-to-Equity | 0.85 | 0.95 | 0.88 |
| Debt-to-Assets | 35.29% | 36.05% | 33.78% |
| Debt-to-Capital | 45.85% | 48.66% | 46.91% |
| Net Debt to EBITDA | 0.93 | 0.74 | 0.75 |
| Current Ratio | N/A | N/A | 2.88 |
| Quick Ratio | 1.59 | 1.49 | 1.64 |
| Financial Leverage | 2.40 | 2.63 | 2.62 |
The balance sheet reflects a prudent leverage strategy, with moderate debt levels that seem manageable given the current profitability ratios.
🌟 Fundamental Strength & Profitability
Evaluating profitability metrics offers insights into operational efficiency and competitive positioning in the market.
| Year | 2025 | 2024 | 2023 |
|---|---|---|---|
| Return on Equity | 45.66% | 56.85% | 58.72% |
| Return on Assets | 19.04% | 21.62% | 22.45% |
| Margins: Net | 9.51% | 11.12% | 11.10% |
| Margins: EBIT | 13.99% | 15.50% | 15.74% |
| Margins: EBITDA | 15.41% | 16.88% | 17.03% |
| Margins: Gross | 39.06% | 38.96% | 39.42% |
| Research & Development to Revenue | 0% | 0% | 0% |
Grainger's steady profitability and high return on equity highlight its effective management and strong competitive advantage in the industrial sector.
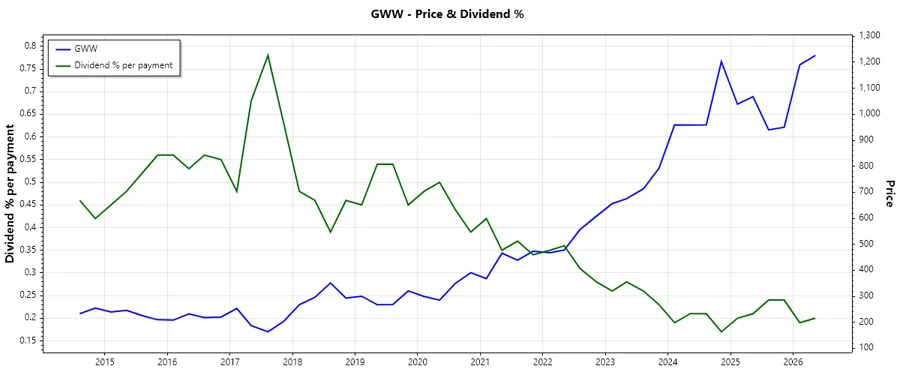
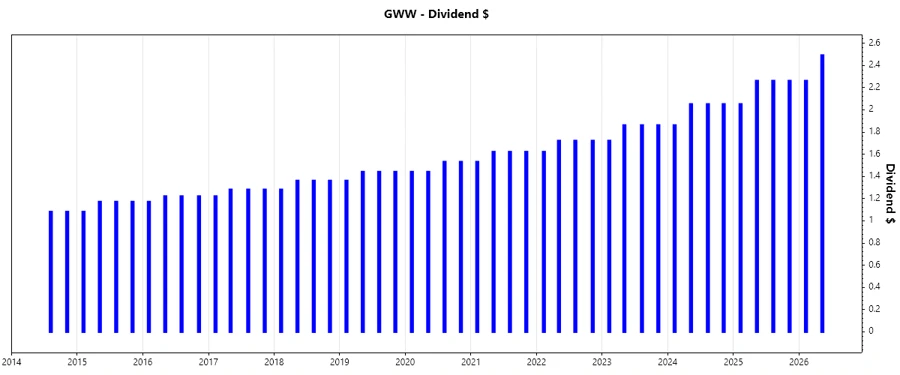
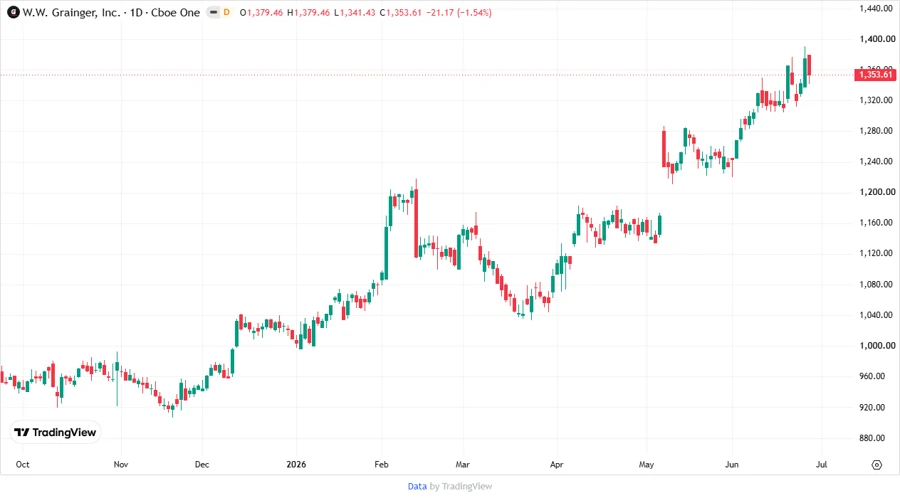
💹 Price Development
📊 Dividend Scoring System
| Category | Score | |
|---|---|---|
| Dividend yield | 3 | |
| Dividend Stability | 5 | |
| Dividend growth | 4 | |
| Payout ratio | 5 | |
| Financial stability | 4 | |
| Dividend continuity | 5 | |
| Cashflow Coverage | 4 | |
| Balance Sheet Quality | 4 |
Total Score: 34/40
🔍 Rating
Based on Grainger's dividend profile and financial metrics, the company emerges as a sound investment choice for dividend investors seeking stability and consistent growth. The solid historical dividend performance, coupled with strong profitability metrics, warrants a favorable recommendation for potential and current investors.
Smart Data Insight
Master the Perfect Entry & Exit for this Stock
Don't leave your profits to chance. Historically, this stock follows specific seasonal patterns that institutional traders use to maximize returns.
- ✅ Identify the "Golden Buying Window"
- ✅ Avoid high-risk correction cycles
- ✅ Backtested data from the last 20+ years