October 31, 2025 a 03:31 pm

GWW: Dividend Analysis - W.W. Grainger, Inc.
W.W. Grainger, Inc., a leader in industrial supply, has maintained a robust dividend profile with exceptional consistency over the years. The company's focus on financial stability and a healthy payout ratio offers a reliable income stream for investors. Its substantial market capitalization further underlines its strength in maintaining long-term shareholder value. With a history of 41 consecutive years of dividend payments, W.W. Grainger represents a steadfast investment choice in the industrial sector.
📊 Overview
The fundamental details of W.W. Grainger, Inc. showcase its strategic financial positioning.
| Key Metric | Data |
|---|---|
| Sector | Industrial |
| Dividend yield | 0.92% |
| Current dividend per share | 8.61 USD |
| Dividend history | 41 years |
| Last cut or suspension | None |
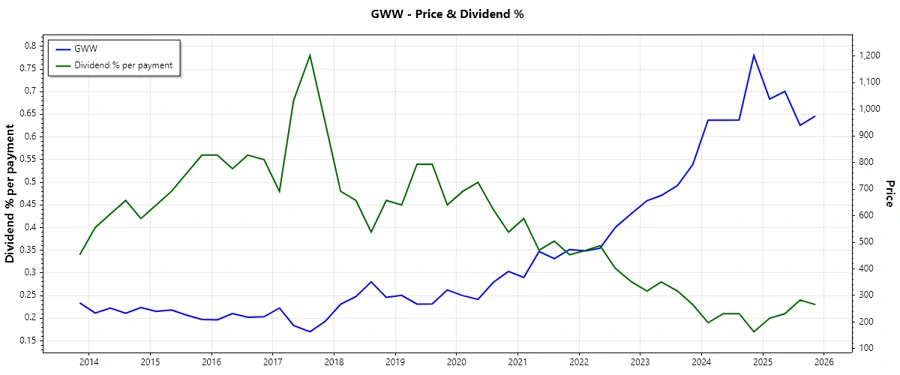
🗣️ Dividend History
The significance of W.W. Grainger's consistent dividend history is paramount for income-focused investors. A track record of uninterrupted payments over four decades signifies stability and trustworthiness.
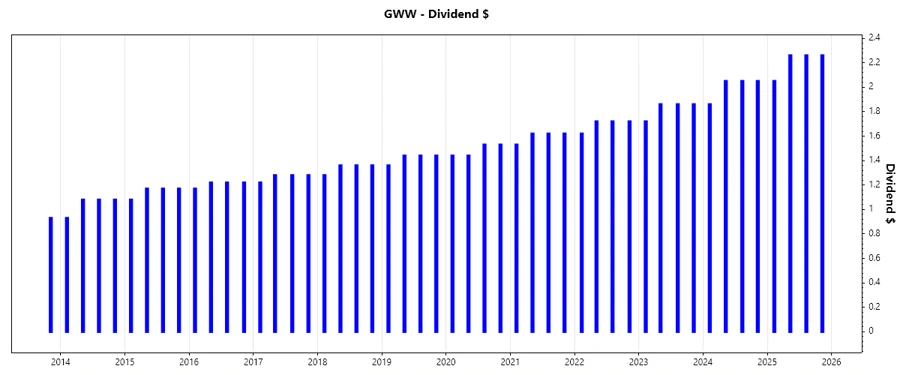
| Year | Dividend per Share (USD) |
|---|---|
| 2025 | 8.83 |
| 2024 | 8.01 |
| 2023 | 7.30 |
| 2022 | 6.78 |
| 2021 | 6.39 |
📈 Dividend Growth
Analyzing the growth trajectory of W.W. Grainger's dividends highlights its commitment to increasing shareholder returns. The growth rates reflect the company's strategic reinvestment and profitability.
| Time | Growth |
|---|---|
| 3 years | 7.82% |
| 5 years | 7.12% |
The average dividend growth is 7.12% over 5 years. This demonstrates moderate but steady dividend growth.
✅ Payout Ratio
Understanding the payout ratio provides insights into W.W. Grainger's dividend sustainability and its capacity to grow dividends while maintaining necessary reserves for growth and unforeseen circumstances.
| Key Figure | Ratio |
|---|---|
| EPS-based | 21.55% |
| Free cash flow-based | 29.08% |
The payout ratios, with 21.55% EPS-based and 29.08% FCF-based, indicate a conservative distribution strategy, leaving room for reinvestment in growth and providing a cushion against downturns.
🗣️ Cashflow & Capital Efficiency
Cash flow analysis and capital efficiency are vital in assessing a firm's financial health and investment potential. The relationship between income and expenditures reveals operational efficacy.
| Metric | 2024 | 2023 | 2022 |
|---|---|---|---|
| Free Cash Flow Yield | 3.05% | 3.84% | 3.80% |
| Earnings Yield | 3.70% | 4.42% | 5.46% |
| CAPEX to Operating Cash Flow | 25.63% | 21.91% | 19.20% |
| Stock-based Compensation to Revenue | 0.36% | 0.38% | 0.32% |
| Free Cash Flow / Operating Cash Flow Ratio | 74.37% | 78.09% | 80.79% |
W.W. Grainger's efficient capital management and cash flow allocation reflect its ability to sustain operations and reward stakeholders adequately.
📉 Balance Sheet & Leverage Analysis
Examining the balance sheet metrics offers a view into W.W. Grainger's financial leverage and stability, providing insights into its capability to manage debt effectively.
| Ratio | 2024 | 2023 | 2022 |
|---|---|---|---|
| Debt-to-Equity | 0.95 | 0.88 | 1.11 |
| Debt-to-Assets | 0.36 | 0.34 | 0.36 |
| Debt-to-Capital | 0.49 | 0.47 | 0.53 |
| Net Debt to EBITDA | 0.74 | 0.75 | 0.99 |
| Current Ratio | 2.82 | 2.88 | 2.48 |
| Quick Ratio | 1.49 | 1.64 | 1.36 |
| Financial Leverage | 2.63 | 2.62 | 3.11 |
W.W. Grainger's low leverage ratios and high liquidity demonstrate its solid financial foundation, allowing for flexibility and resilience in varying business climates.
🗣️ Fundamental Strength & Profitability
A detailed profitability analysis gives insight into the company's efficiency and market competitiveness, impacting its long-term viability and shareholder value.
| Metric | 2024 | 2023 | 2022 |
|---|---|---|---|
| Return on Equity | 56.85% | 58.72% | 63.40% |
| Return on Assets | 21.62% | 22.45% | 20.39% |
| Net Profit Margin | 11.12% | 11.10% | 10.16% |
| EBIT Margin | 15.50% | 15.74% | 14.47% |
| EBITDA Margin | 16.88% | 17.03% | 15.79% |
| Gross Margin | 38.96% | 39.42% | 38.41% |
| Research & Development to Revenue | 0% | 0% | 0% |
With remarkable profitability metrics, W.W. Grainger's operational efficiency and innovative strategies position it for sustained growth and competitive edge in the industrial sector.
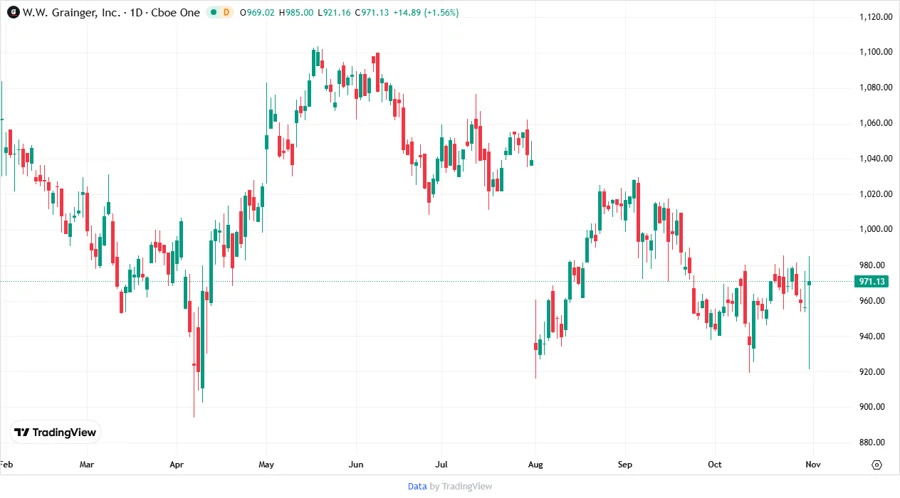
⚠️ Price Development
🔍 Dividend Scoring System
An individualized dividend scoring assessment based on several critical parameters provides a quantified approach to evaluate W.W. Grainger's dividend quality.
| Criterion | Score | |
|---|---|---|
| Dividend Yield | 3 | |
| Dividend Stability | 5 | |
| Dividend Growth | 4 | |
| Payout Ratio | 5 | |
| Financial Stability | 5 | |
| Dividend Continuity | 5 | |
| Cashflow Coverage | 4 | |
| Balance Sheet Quality | 5 |
Total Score: 36/40
⭐ Rating
In conclusion, W.W. Grainger, Inc. presents itself as a highly reliable dividend-paying stock, suitable for conservative investors seeking stable income and gradual capital appreciation. The robust financial health, consistent dividend growth, and strong payout ratios make it a prudent addition to a diversified portfolio.
Smart Data Insight
Master the Perfect Entry & Exit for this Stock
Don't leave your profits to chance. Historically, this stock follows specific seasonal patterns that institutional traders use to maximize returns.
- ✅ Identify the "Golden Buying Window"
- ✅ Avoid high-risk correction cycles
- ✅ Backtested data from the last 20+ years