October 13, 2025 a 03:31 am


GWW: Dividend Analysis - W.W. Grainger, Inc.
W.W. Grainger, Inc. demonstrates a compelling dividend profile, reflecting stability and sustainable growth. The company has a remarkable dividend history of 41 years, with no recent cuts or suspensions. This positions Grainger as a reliable dividend payer. However, its modest dividend yield suggests investors should weigh income potential against capital growth prospects.
📊 Overview
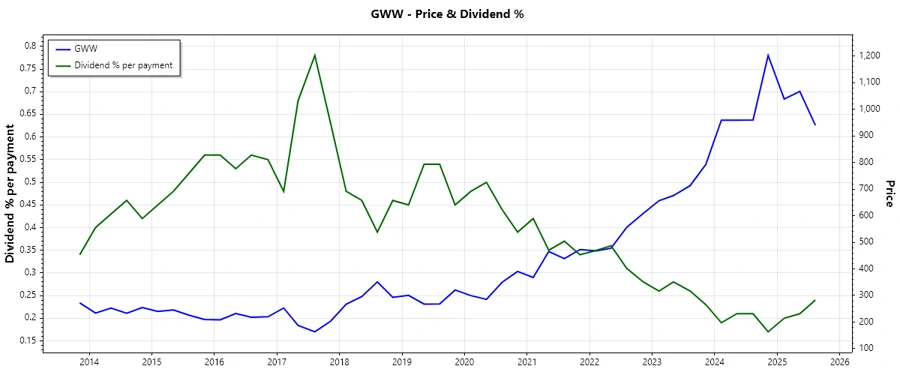
W.W. Grainger operates in the industrial supply sector, providing a vast range of maintenance, repair, and operations products. The company's current dividend yield is moderate at 0.92% with a notable track record of consistent dividend payments over the last 41 years.
| Sector | Dividend Yield | Current Dividend per Share | Dividend History | Last Cut or Suspension |
|---|---|---|---|---|
| Industrial Supply | 0.92% | 8.61 USD | 41 years | None |
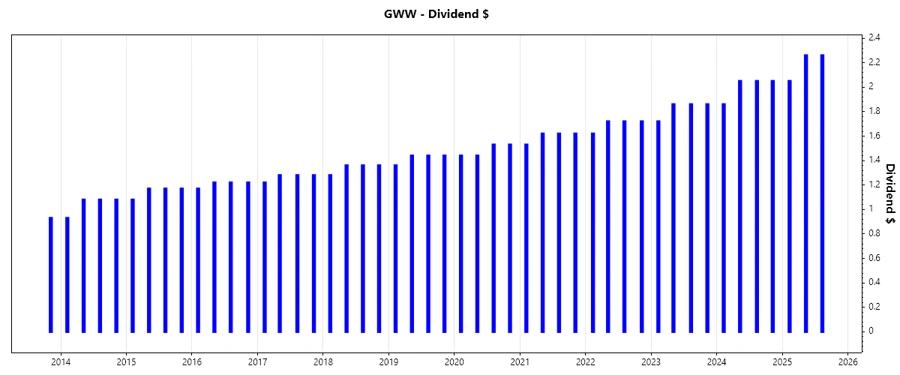
🗣️ Dividend History
Grainger's long history of dividend payments underlines its commitment to returning capital to shareholders. Such a lengthy record is indicative of strong financial health and reliable cash flow.
| Year | Dividend per Share (USD) |
|---|---|
| 2025 | 6.57 |
| 2024 | 8.01 |
| 2023 | 7.30 |
| 2022 | 6.78 |
| 2021 | 6.39 |
📈 Dividend Growth
The growth rate of dividends is crucial for evaluating a company's future income potential. A stable and positive growth reinforces investor confidence.
| Time | Growth |
|---|---|
| 3 years | 7.82% |
| 5 years | 7.12% |
The average dividend growth is 7.12% over 5 years. This shows moderate but steady dividend growth, indicating strong and sustainable performance ahead.
📉 Payout Ratio
Payout ratios help assess whether a company can sustainably cover its dividend payments. Lower ratios often point to more significant room for growth or reinvestment.
| Key Figure | Ratio |
|---|---|
| EPS-based | 21.55% |
| Free Cash Flow-based | 29.08% |
The payout ratio based on EPS is quite low at 21.55%, indicating ample room to potentially increase dividends or reinvest in business growth. The FCF-based ratio at 29.08% supports a healthy cash return ability.
✅ Cashflow & Capital Efficiency
Analysis of cash flow and capital efficiency helps assess whether a company can fund its operations and growth while returning value to shareholders.
| Year | Free Cash Flow Yield | Earnings Yield | CAPEX to Operating Cash Flow | Stock-based Compensation to Revenue | Free Cash Flow / Operating Cash Flow Ratio |
|---|---|---|---|---|---|
| 2022 | 3.80% | 5.46% | 19.20% | 0.31% | 80.79% |
| 2023 | 3.84% | 4.42% | 21.91% | 0.38% | 78.09% |
| 2024 | 3.05% | 3.70% | 25.63% | 0.36% | 74.37% |
The cash flow metrics suggest efficient capital usage and healthy cash flow generation, essential for sustaining and potentially increasing dividends.
⚠️ Balance Sheet & Leverage Analysis
An examination of leverage and balance sheet quality reveals the company's financial stability and its ability to withstand economic fluctuations.
| Year | Debt-to-Equity | Debt-to-Assets | Debt-to-Capital | Net Debt to EBITDA | Current Ratio | Quick Ratio | Financial Leverage |
|---|---|---|---|---|---|---|---|
| 2022 | 1.11 | 35.65% | 52.58% | 0.99 | NA | 1.36 | 3.11 |
| 2023 | 0.88 | 33.78% | 46.91% | 0.75 | NA | 1.64 | 2.62 |
| 2024 | 0.95 | 36.05% | 48.66% | 0.74 | NA | 1.49 | 2.63 |
Grainger maintains a levered but stable financial position, supported by strong liquidity ratios which ensure the company can meet its short-term obligations.
📌 Fundamental Strength & Profitability
Analysis of profitability and fundamental ratios reveals the company's operational efficiency and profitability.
| Year | Return on Equity | Return on Assets | Margins: Net | EBIT | EBITDA | Gross | R&D to Revenue |
|---|---|---|---|---|---|---|---|
| 2022 | 63.40% | 20.39% | 10.16% | 14.47% | 15.79% | 38.41% | 0% |
| 2023 | 58.72% | 22.45% | 11.10% | 15.74% | 17.03% | 39.42% | 0% |
| 2024 | 56.85% | 21.62% | 11.12% | 15.50% | 16.88% | 38.96% | 0% |
The company's strong return metrics and robust margins underscore its formidable market position and profitability prospects, supporting continued dividend payments.
📈 Price Development
🧮 Dividend Scoring System
| Criteria | Score | Bar |
|---|---|---|
| Dividend yield | 3 | |
| Dividend Stability | 5 | |
| Dividend growth | 4 | |
| Payout ratio | 5 | |
| Financial stability | 4 | |
| Dividend continuity | 5 | |
| Cashflow Coverage | 4 | |
| Balance Sheet Quality | 4 |
Total Score: 34/40
📜 Rating
W.W. Grainger, Inc. is rated as a solid dividend-paying company with an impressive track record of dividend stability and growth. Although its dividend yield may not stand out, the company’s strong financial fundamentals and growth potential make it a compelling choice for dividend-focused investors.
Smart Data Insight
Master the Perfect Entry & Exit for this Stock
Don't leave your profits to chance. Historically, this stock follows specific seasonal patterns that institutional traders use to maximize returns.
- ✅ Identify the "Golden Buying Window"
- ✅ Avoid high-risk correction cycles
- ✅ Backtested data from the last 20+ years