August 26, 2025 a 02:47 am


GWW: Dividend Analysis - W.W. Grainger, Inc.
W.W. Grainger, Inc. (GWW) is a robust dividend-paying company with a commendable history of consecutive dividend increases spanning over four decades. With a modest dividend yield, it demonstrates cautious distribution strategies, ensuring sustainable payouts. The company's financials reflect strong profitability and sound capital management, indicating a solid backdrop for continued dividend reliability.
📊 Overview
The overview of W.W. Grainger, Inc.'s dividend metrics highlights its presence in the industrial sector. Below are the key data points:
| Metric | Value |
|---|---|
| Sector | Industrial |
| Dividend yield | 0.92 % |
| Current dividend per share | 8.61 USD |
| Dividend history | 41 years |
| Last cut or suspension | None |
📈 Dividend History
The extensive dividend history is testament to W.W. Grainger, Inc.’s consistent financial performance and commitment to shareholders. Below is a visual depiction of recent dividend trends:
| Year | Dividend per Share (USD) |
|---|---|
| 2025 | 6.57 |
| 2024 | 8.01 |
| 2023 | 7.30 |
| 2022 | 6.78 |
| 2021 | 6.39 |
📈 Dividend Growth
Dividend growth is a crucial indicator of a company's long-term financial health and commitment towards rewarding shareholders.
| Time | Growth |
|---|---|
| 3 years | 7.82 % |
| 5 years | 7.12 % |
The average dividend growth is 7.12% over 5 years. This shows moderate but steady dividend growth.
✅ Payout Ratio
Payout ratios provide insights into the company's ability to sustain its dividends. Here’s a look at W.W. Grainger, Inc.’s payout ratios:
| Key figure | Ratio |
|---|---|
| EPS-based | 21.55 % |
| Free cash flow-based | 29.08 % |
The EPS-based payout ratio is 21.55% and the FCF-based payout ratio is 29.08%, indicating prudent and sustainable dividend practices.
💵 Cashflow & Capital Efficiency
Analyzing W.W. Grainger, Inc.'s cash flow dynamics aids in understanding its capital efficiency and overall financial health:
| 2024 | 2023 | 2022 | |
|---|---|---|---|
| Free Cash Flow Yield | 3.05% | 3.84% | 3.80% |
| Earnings Yield | 3.70% | 4.42% | 5.46% |
| CAPEX to Operating Cash Flow | 25.63% | 21.91% | 19.20% |
| Stock-based Compensation to Revenue | 0.36% | 0.38% | 0.32% |
| Free Cash Flow / Operating Cash Flow Ratio | 74.37% | 78.09% | 80.80% |
The financials reveal solid cash flow management with sustainable CAPEX levels, underlining strong capital efficiency.
📉 Balance Sheet & Leverage Analysis
Leverage analysis paints a picture of the company's debt levels and capital structure, helping gauge financial stability:
| 2024 | 2023 | 2022 | |
|---|---|---|---|
| Debt-to-Equity | 0.95 | 0.88 | 1.11 |
| Debt-to-Assets | 0.36 | 0.34 | 0.36 |
| Debt-to-Capital | 0.49 | 0.47 | 0.53 |
| Net Debt to EBITDA | 0.74 | 0.75 | 0.99 |
| Current Ratio | 2.49 | 2.88 | 2.48 |
| Quick Ratio | 1.49 | 1.64 | 1.36 |
| Financial Leverage | 2.63 | 2.62 | 3.11 |
The leverage metrics suggest efficient debt management aligning with the company's capital strategy, bolstering its financial resilience.
Profitability & Fundamental Strength
Profitability ratios highlight operational efficiency and core strength of W.W. Grainger, Inc.:
| 2024 | 2023 | 2022 | |
|---|---|---|---|
| Return on Equity | 56.85% | 58.72% | 63.40% |
| Return on Assets | 21.62% | 22.45% | 20.39% |
| Margins: Net | 11.12% | 11.10% | 10.16% |
| EBIT | 15.50% | 15.74% | 14.47% |
| EBITDA | 16.88% | 17.03% | 15.79% |
| Gross | 39.36% | 39.42% | 38.41% |
| Research & Development to Revenue | 0% |
The profitability indicators show strong returns and efficient margins, reflecting the company's robust operational model.
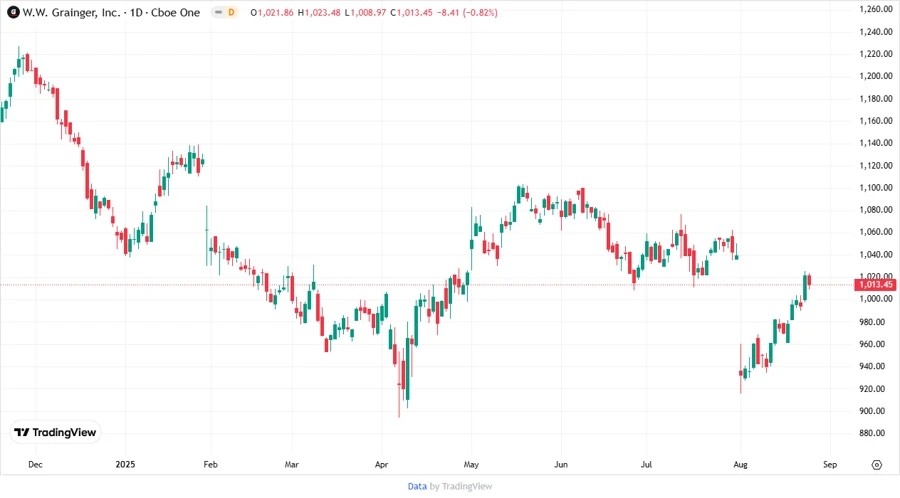
Stock Performance
🗣️ Dividend Scoring System
Our dividend scoring system evaluates multiple factors, providing a comprehensive score on W.W. Grainger, Inc.'s dividend strength:
| Category | Score | Bar |
|---|---|---|
| Dividend yield | 3 | |
| Dividend Stability | 5 | |
| Dividend growth | 4 | |
| Payout ratio | 4 | |
| Financial stability | 5 | |
| Dividend continuity | 5 | |
| Cashflow Coverage | 4 | |
| Balance Sheet Quality | 5 |
Total Score: 35/40
Final Rating
Overall, W.W. Grainger, Inc. exhibits a strong dividend profile supported by excellent financial health and consistent growth, making it an attractive option for dividend-focused investors looking for a steady income stream and long-term capital appreciation.
Smart Data Insight
Master the Perfect Entry & Exit for this Stock
Don't leave your profits to chance. Historically, this stock follows specific seasonal patterns that institutional traders use to maximize returns.
- ✅ Identify the "Golden Buying Window"
- ✅ Avoid high-risk correction cycles
- ✅ Backtested data from the last 20+ years