November 07, 2025 a 09:03 am


GS: Trend and Support & Resistance Analysis - The Goldman Sachs Group, Inc.
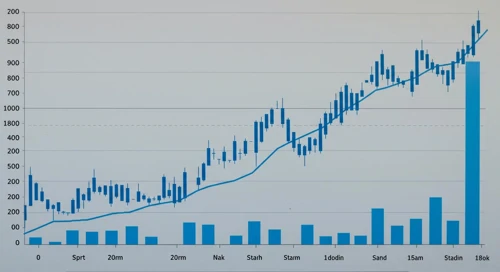
The Goldman Sachs Group has been showing significant price volatility over the recent months. The stock has experienced both upward and downward trends, reflective of the broader financial market uncertainties. With a diverse offering of financial services, Goldman Sachs remains a pivotal player in the global finance sector. Analyzing the technical indicators like EMA20 and EMA50, alongside key support and resistance levels, can provide investors with critical insights regarding potential future movements of its stock price.
Trend Analysis
The technical analysis of GS stock over the last several months indicates varied market sentiments. Calculating the Exponential Moving Averages (EMA) for 20 and 50 days provides insights into prevalent trends. The latest analyses show:
| Date | Close Price | Trend |
|---|---|---|
| 2025-11-06 | 787.58 | ↓ ▼ |
| 2025-11-05 | 793.09 | ↓ ▼ |
| 2025-11-04 | 790.83 | ↓ ▼ |
| 2025-11-03 | 785.52 | ↓ ▼ |
| 2025-10-31 | 789.37 | ↓ ▼ |
| 2025-10-30 | 790.16 | ↓ ▼ |
| 2025-10-29 | 783.06 | ↓ ▼ |
The data reveals a sustained downtrend in the recent price activity, marked clearly by the EMA20 remaining below the EMA50, indicating weaker short-term momentum.
Support and Resistance
Analyzing the support and resistance levels for GS provides key insights into potential price thresholds where buying or selling momentum could change. Key zones were identified as follows:
| Zone Type | From | To |
|---|---|---|
| Support | ↙ 750.00 | ↙ 760.00 |
| Support | ↙ 770.00 | ↙ 780.00 |
| Resistance | ↑ 800.00 | ↑ 810.00 |
| Resistance | ↑ 820.00 | ↑ 830.00 |
Currently, the stock price is positioned between the support zone of 770 to 780, indicating possible stabilization within this range. However, the persistence of the downward trend may challenge these support levels.
Conclusion
Goldman Sachs' stock has shown recent bearish tendencies, as evidenced by the downward trending EMA indicators. While significant support exists around 770 to 780, continued bearish sentiment could test these levels further. Conversely, should there be positive market or sector news, there exists potential resistance overhead in the 800 to 810 range. For investors, the existing trend offers a cautious stance, but potential market or economic shifts could provide opportunities for upside recovery. Risk management remains critical given the stock's positioning within key technical zones. Overall, analysts must weigh these factors in the context of broader market conditions to determine viable trading strategies for GS.
Smart Data Insight
Master the Perfect Entry & Exit for this Stock
Don't leave your profits to chance. Historically, this stock follows specific seasonal patterns that institutional traders use to maximize returns.
- ✅ Identify the "Golden Buying Window"
- ✅ Avoid high-risk correction cycles
- ✅ Backtested data from the last 20+ years