August 12, 2025 a 09:03 am

GS: Trend and Support & Resistance Analysis - The Goldman Sachs Group, Inc.
Goldman Sachs Group Inc. has shown robust performance over the past months, demonstrating resilience in volatile markets. The financial services behemoth has sustained an upward trajectory in stock price after a substantial period of recovery. Investors hold optimistic views as key financial metrics continue to improve. Leveraging their diverse segments, GS is poised for future growth. However, market volatility and regulatory changes pose potential risks.
Trend Analysis
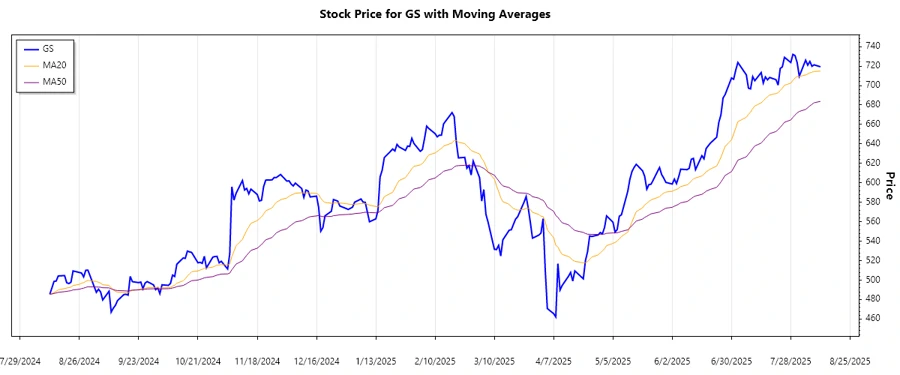
Analyzing the daily closing prices of Goldman Sachs (GS) and calculating the Exponential Moving Averages (EMA), both the EMA20 and EMA50, we identify that currently, the EMA20 is hovering around the price level slightly above the EMA50, pointing towards a significant but mild ▲ upward trend. The consistency of this trend over the past week is promising for investors.
| Date | Closing Price | Trend Direction |
|---|---|---|
| 2025-08-08 | 721.27 | ▲ Up |
| 2025-08-07 | 719.74 | ▲ Up |
| 2025-08-06 | 724.74 | ▲ Up |
| 2025-08-05 | 720.91 | ▲ Up |
| 2025-08-04 | 726.03 | ▲ Up |
| 2025-08-01 | 709.57 | ▲ Up |
| 2025-07-31 | 723.59 | ▲ Up |
In conclusion, the current trend indicates an upward momentum with potential for continued strength if market conditions persist without significant disruptions.
Support and Resistance
Upon analysis, two support zones identified from the historical data are at levels between approximately $700-$710 and $720-$730. Meanwhile, resistance zones are identified around $740-$750 and $760-$770. At the current price level, GS is around the higher end of the second support zone, suggesting it might soon test the nearby resistance levels, providing a critical moment for traders.
| Zone | From | To |
|---|---|---|
| Support Zone 1 | $700 | $710 |
| Support Zone 2 | $720 | $730 |
| Resistance Zone 1 | $740 | $750 |
| Resistance Zone 2 | $760 | $770 |
Current observations suggest the price is approaching the resistance zone, providing strategic points for monitoring potential breakouts or reversals.
Conclusion
The Goldman Sachs stock demonstrates a solid upward trend, strengthened by robust financial performance. With the current positioning near a significant resistance level, the potential for upward movement exists, albeit with caution advised due to potential economic volatility. Investors are advised to monitor the technical levels closely for strategic entry and exit points. The resilience of GS amidst financial challenges speaks to its potential as a long-term investment, though market factors remain a crucial element in future performance.
Smart Data Insight
Master the Perfect Entry & Exit for this Stock
Don't leave your profits to chance. Historically, this stock follows specific seasonal patterns that institutional traders use to maximize returns.
- ✅ Identify the "Golden Buying Window"
- ✅ Avoid high-risk correction cycles
- ✅ Backtested data from the last 20+ years