
June 16, 2026 a 04:44 pm

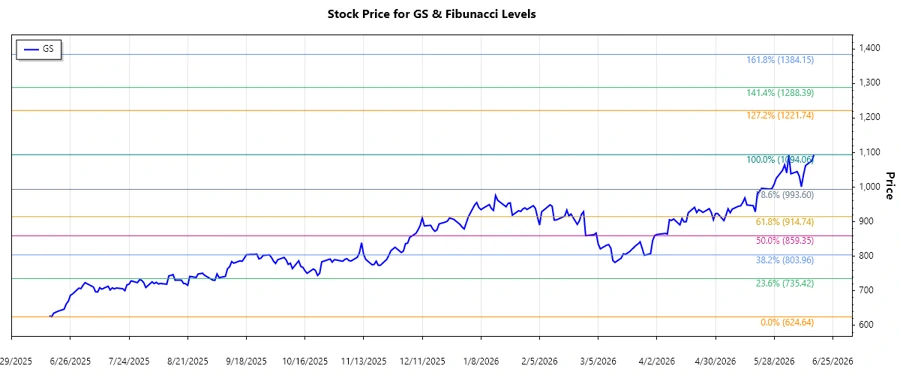
GS: Fibonacci Analysis - The Goldman Sachs Group, Inc.
The Goldman Sachs Group, Inc. (GS) has exhibited a notable price trend in the past few months. The dominant trend observed is an upward trajectory, moving from lows around $624.64 to highs near $1094.055. This trend reflects investor confidence and market strength in the current financial environment. As we delve into Fibonacci levels, these will offer insight into potential support and resistance zones for future price action.
Fibonacci Analysis
The analysis identifies a recent upward trend for GS. This analysis derives Fibonacci retracement levels to anticipate future price movements.
| Analysis Element | Detail |
|---|---|
| Start Date | 2025-06-16 |
| End Date | 2026-06-16 |
| High Point | $1094.055 (2026-06-16) |
| Low Point | $624.64 (2025-06-17) |
| Fibonacci Level | Price Level |
|---|---|
| 0.236 | $986.45 |
| 0.382 | $901.52 |
| 0.5 | $859.35 |
| 0.618 | $817.18 |
| 0.786 | $757.14 |
The current price, approximately $1094.055, is above the high point, indicating no current retracement within defined Fibonacci levels. This suggests strength and potential further upward momentum.
This positioning suggests the $986.45 level could serve as a strong support, should any retracement occur, while $1094.055 remains a resistance point if the trend reverses.
Conclusion
The Goldman Sachs Group, Inc. (GS) exhibits a strong upward trend, supported by solid financial fundamentals and market confidence. Potential risks include general market volatility and economic fluctuations, but current technical indicators suggest supportive growth. This trend implies promising opportunities for investors betting on sustained economic recovery and financial sector growth.
Smart Data Insight
Master the Perfect Entry & Exit for this Stock
Don't leave your profits to chance. Historically, this stock follows specific seasonal patterns that institutional traders use to maximize returns.
- ✅ Identify the "Golden Buying Window"
- ✅ Avoid high-risk correction cycles
- ✅ Backtested data from the last 20+ years