May 13, 2026 a 06:44 am
GS: Fibonacci Analysis - The Goldman Sachs Group, Inc.
The Goldman Sachs stock has notably shown an upward trend over the recent months. With its broad range of services in investment banking and wealth management, the company has demonstrated resilience in the financial markets. The recent upward momentum may suggest potential bullish opportunities for investors. However, it remains crucial to monitor the technical indicators and retracement levels for signs of possible pullbacks or corrections.
Fibonacci Analysis
| Details | Information |
|---|---|
| Trend Start Date | 2025-06-02 |
| Trend End Date | 2026-05-12 |
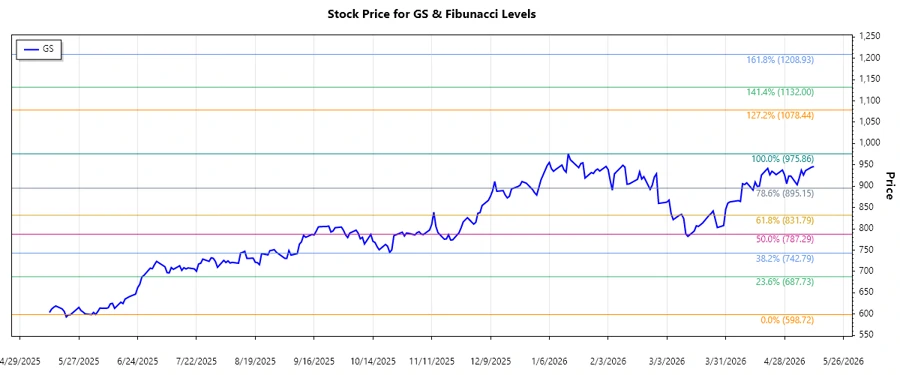
| Highest Price | 975.86 on 2026-01-15 |
| Lowest Price | 598.72 on 2025-06-02 |
| Fibonacci Levels |
|
| Retracement Zone | None, current price is $945.9 |
| Interpretation | The current price remains above most Fibonacci retracement levels, indicating a strong upward support. Potential support observed at the 0.618 level, suggesting the trend may continue upward unless a reversal occurs. |
Conclusion
The Goldman Sachs Group, Inc. continues to showcase significant upward momentum in its stock prices, indicative of robust growth in its financial services portfolio. Currently, the stock is trading above key Fibonacci levels, suggesting investor confidence and the potential for sustained growth. However, market volatility and unforeseen economic factors present risks that could impact this trajectory. Technical analysis reveals that should the retracement point of 0.618 be breached downward, it may signal a cautionary pivot. Ultimately, while opportunities for bullish engagement exist, prudent monitoring of future price movements serves as a key strategy for investors.
Smart Data Insight
Master the Perfect Entry & Exit for this Stock
Don't leave your profits to chance. Historically, this stock follows specific seasonal patterns that institutional traders use to maximize returns.
- ✅ Identify the "Golden Buying Window"
- ✅ Avoid high-risk correction cycles
- ✅ Backtested data from the last 20+ years