May 05, 2026 a 07:30 am

GS: Dividend Analysis - The Goldman Sachs Group, Inc.
The Goldman Sachs Group, Inc., with a current market capitalization of approximately $268 billion, continues to be a formidable presence in the financial sector. Its dividend profile reflects a combination of conservative payout strategies and a solid historical track record of consistent dividend growth. As a staple in the investment community, GS's approach to shareholder returns through dividends remains a key attraction for investors seeking income stability.
📊 Overview
The Goldman Sachs Group, Inc. operates within the financial sector, offering a diverse range of financial services. With a respectable dividend yield of 1.88%, it provides an appealing option for income-focused investors. The current dividend per share stands at $16.88, underscoring the company's commitment to returning capital to shareholders. Notably, GS boasts 28 years of consecutive dividend payments, with no recent cuts or suspensions, reflecting its dividend reliability.
| Sector | Dividend Yield (%) | Current Dividend per Share (USD) | Dividend History (Years) | Last Cut or Suspension |
|---|---|---|---|---|
| Financial | 1.88% | $16.88 | 28 | None |
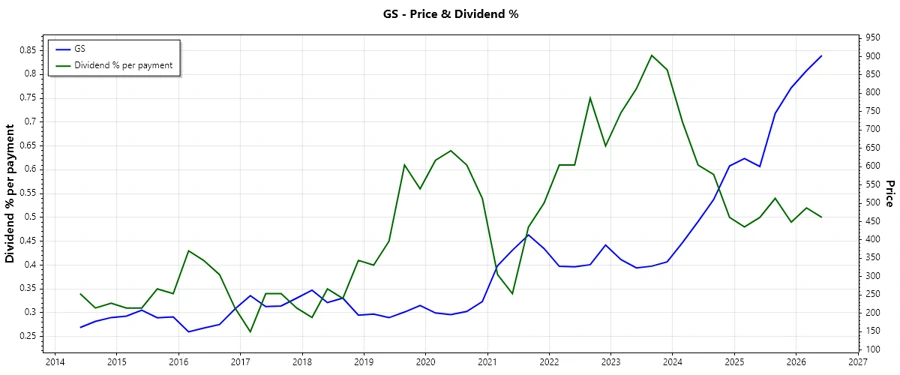
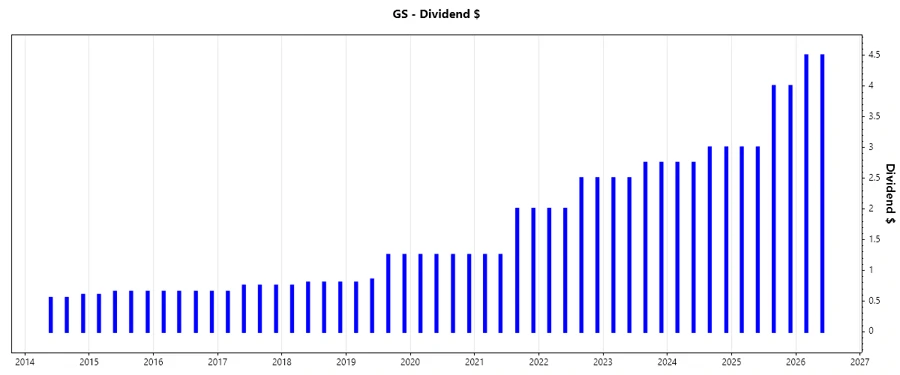
📈 Dividend History
The historical dividend payments by Goldman Sachs demonstrate the company's robust approach to rewarding its shareholders consistently. With a track record spanning 28 years, the firm has built a level of trust and reliability in its dividend policies. The importance of a stable dividend history cannot be overstated, as it often reflects underlying financial strength and management's confidence in future earnings.
| Year | Dividend per Share (USD) |
|---|---|
| 2026 | 9.00 |
| 2025 | 14.00 |
| 2024 | 11.50 |
| 2023 | 10.50 |
| 2022 | 9.00 |
📉 Dividend Growth
Dividend growth is a critical metric for evaluating a company's ability to enhance shareholder value over time. Goldman Sachs has demonstrated a measurable dividend growth of 15.87% over the past 3 years and 22.87% over the past 5 years. This trend indicates a commitment to increasing payouts corresponding to profit growth, crucial for investors looking at long-term yield enhancement.
| Time | Growth (%) |
|---|---|
| 3 years | 15.87% |
| 5 years | 22.87% |
The average dividend growth is 22.87% over 5 years. This shows moderate but steady dividend growth.
✅ Payout Ratio
The payout ratio is a vital indicator of a company's dividend sustainability. For Goldman Sachs, the EPS-based payout ratio stands at 28.38%, and the free cash flow-based payout ratio is -11.95%. The relatively low EPS payout ratio suggests that the company is not overstretching its earnings to provide dividends, which can be a positive sign of dividend sustainability.
| Key Figure | Ratio (%) |
|---|---|
| EPS-based | 28.38% |
| Free cash flow-based | -11.95% |
🗣️ Cashflow & Capital Efficiency
The cash flow metrics highlight how effectively Goldman Sachs converts its revenues into cash and manages its capital. Strong cash flows are vital for sustaining dividend payments and investing in growth opportunities. The company's metrics over recent years show varying degrees of capital efficiency and cash flow generation, vital for assessing overall economic value addition.
| Metric | 2023 | 2024 | 2025 |
|---|---|---|---|
| Free Cash Flow Yield | -11.34% | -8.15% | -17.18% |
| Earnings Yield | 6.48% | 7.60% | 6.25% |
| CAPEX to Operating Cash Flow | -18.40% | -15.83% | -4.57% |
| Stock-based Compensation to Revenue | 1.92% | 2.10% | 2.75% |
| Free Cash Flow / Operating Cash Flow Ratio | 118.40% | 115.83% | 104.57% |
GS's cash flow data suggest diligent cash management practices, albeit with some recent variability in cash flow generation.
🗣️ Balance Sheet & Leverage Analysis
Assessing the balance sheet provides insights into Goldman Sachs' financial stability and its ability to manage debts. A sound leverage structure can greatly influence dividend stability, impacting investor perceptions and credit ratings.
| Metric | 2023 | 2024 | 2025 |
|---|---|---|---|
| Debt-to-Equity | 498.81% | 505.70% | 487.73% |
| Debt-to-Assets | 35.52% | 36.81% | 33.69% |
| Debt-to-Capital | 83.30% | 83.49% | 82.99% |
| Net Debt to EBITDA | 21.90x | 20.92x | 18.53x |
| Current Ratio | 0.94 | 0.93 | 0.83 |
| Quick Ratio | 0.94 | 0.93 | 0.83 |
| Financial Leverage | 14.04 | 13.74 | 14.48 |
The leverage metrics reveal an extensive use of debt financing, necessitating careful monitoring to avoid potential financial strains.
🗣️ Fundamental Strength & Profitability
These metrics offer a comprehensive view of GS's profitability and operational effectiveness. High return rates on equity and assets typically indicate efficient resource use, critical for sustaining long-term shareholder value.
| Metric | 2023 | 2024 | 2025 |
|---|---|---|---|
| Return on Equity | 7.28% | 11.70% | 13.74% |
| Return on Assets | 0.52% | 0.85% | 0.95% |
| Margins: Net | 7.85% | 11.25% | 13.73% |
| Margins: EBIT | 9.91% | 14.50% | 17.47% |
| Margins: EBITDA | 14.38% | 16.39% | 19.21% |
| Margins: Gross | 41.71% | 41.12% | 47.48% |
| Research & Development to Revenue | 0% | 0% | 0% |
Although GS shows solid profitability metrics, its growth in margins suggests room for continued operational improvements.
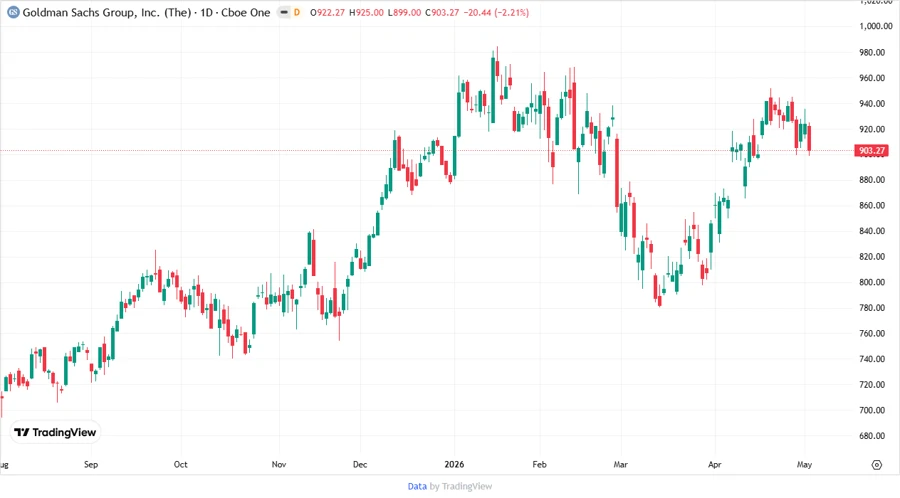
Price Development
✅ Dividend Scoring System
| Criteria | Score/5 | Score Bar |
|---|---|---|
| Dividend Yield | 3 | |
| Dividend Stability | 4 | |
| Dividend Growth | 4 | |
| Payout Ratio | 4 | |
| Financial Stability | 3 | |
| Dividend Continuity | 5 | |
| Cashflow Coverage | 2 | |
| Balance Sheet Quality | 3 |
Total Score: 28/40
⚠️ Rating
The Goldman Sachs Group, Inc. maintains a promising dividend profile, characterized by consistent growth and stability. While the payout ratio is conservative, ensuring dividends are sustainable, certain financial metrics suggest the need for continued vigilance regarding debt management. Overall, GS provides an attractive option for dividend-seeking investors willing to navigate financial industry complexities.
Smart Data Insight
Master the Perfect Entry & Exit for this Stock
Don't leave your profits to chance. Historically, this stock follows specific seasonal patterns that institutional traders use to maximize returns.
- ✅ Identify the "Golden Buying Window"
- ✅ Avoid high-risk correction cycles
- ✅ Backtested data from the last 20+ years