January 01, 2026 a 02:46 am

📊 GS: Dividend Analysis - The Goldman Sachs Group, Inc.
The Goldman Sachs Group, Inc. offers a compelling dividend profile with a standing history of 27 years. Despite a relatively modest dividend yield, the company's continuous growth in dividends per share underscores its commitment to rewarding shareholders. Its past dividend suspension in 2010 marks a rare event, and since then, Goldman Sachs has demonstrated stability in payouts, indicating resilience and financial health.
📜 Overview
Goldman Sachs operates within the Financial sector, maintaining a dividend yield of 1.72%. With an impressive track record, the company has sustained a substantial dividend history over 27 years, demonstrating robust shareholder value creation. Despite the last dividend cut or suspension recorded in 2010, Goldman Sachs has consistently enhanced its dividend per share, currently standing at $13.71 USD.
| Metric | Value |
|---|---|
| Sector | Financial |
| Dividend yield | 1.72% |
| Current dividend per share | 13.71 USD |
| Dividend history | 27 years |
| Last cut or suspension | 2010 |
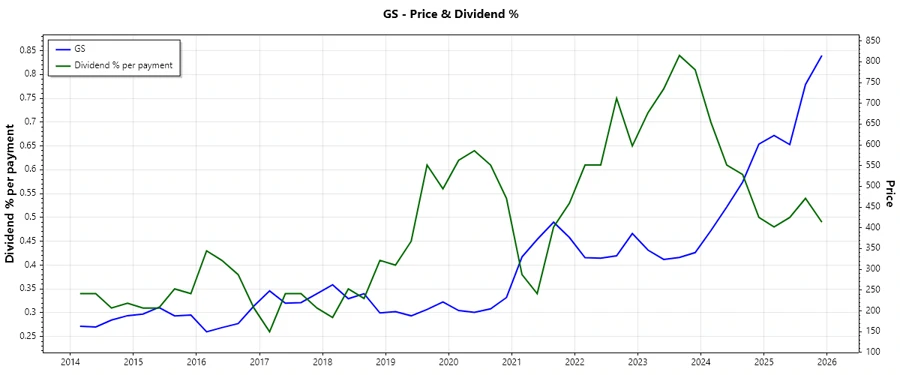
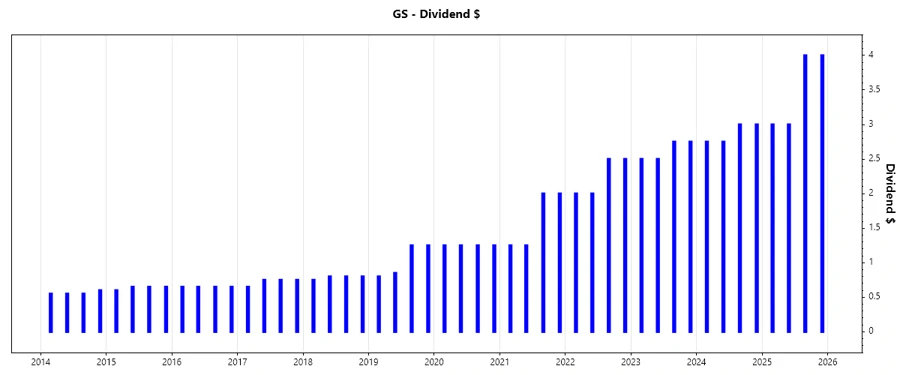
📈 Dividend History
Goldman Sachs' dividend history is a testament to its consistent commitment to shareholder returns. Tracking dividend payouts over multiple years reveals the company's prioritization of shareholder wealth, even amidst economic fluctuations.
| Year | Dividend per Share (USD) |
|---|---|
| 2025 | 14.00 |
| 2024 | 11.50 |
| 2023 | 10.50 |
| 2022 | 9.00 |
| 2021 | 6.50 |
📊 Dividend Growth
The analysis of dividend growth is crucial for understanding the company's capacity to enhance shareholder returns over time. Goldman Sachs exhibits moderate yet consistent growth patterns, indicating stable financial performance and strategic reinvestment.
| Time | Growth |
|---|---|
| 3 years | 15.87% |
| 5 years | 22.87% |
The average dividend growth is 22.87% over 5 years. This shows moderate but steady dividend growth.
⚖️ Payout Ratio
Payout ratios are fundamental indicators of dividend sustainability. They show how well earnings support dividend payments and whether payouts are at risk of cuts during lean periods.
| Key figure | Ratio |
|---|---|
| EPS-based | 25.46% |
| Free cash flow-based | -17.28% |
With an EPS payout ratio of 25.46% and a negative free cash flow payout ratio of -17.28%, Goldman Sachs appears to prudently manage earnings for dividends, ensuring maintainable growth and financial health.
💵 Cashflow & Capital Efficiency
Understanding cash flow profiles and capital efficiency is vital for evaluating a company's financial prowess and operational effectiveness, showcasing the capacity to generate value from operations efficiently.
| Year | Metric | 2024 | 2023 | 2022 |
|---|---|---|---|---|
| Free Cash Flow Yield | -0.08 | -0.11 | 0.04 | |
| Earnings Yield | 0.08 | 0.06 | 0.09 | |
| CAPEX to Operating Cash Flow | -0.16 | -0.18 | 0.43 | |
| Stock-based Compensation to Revenue | 0.02 | 0.02 | 0.06 | |
| Free Cash Flow / Operating Cash Flow Ratio | 1.16 | 1.18 | 0.57 |
The cashflow stability is compromised by recent negative cash flow yields; however, the operational efficiencies indicated by positive ratios in previous years suggest potential for future improvement.
📉 Balance Sheet & Leverage Analysis
A comprehensive assessment of leverage provides insight into a company's long-term solvency and the balance of equity versus debt financing, crucial for evaluating financial risk levels.
| Year | Metric | 2024 | 2023 | 2022 |
|---|---|---|---|---|
| Debt-to-Equity | 5.06 | 4.99 | 3.71 | |
| Debt-to-Assets | 0.37 | 0.36 | 0.30 | |
| Debt-to-Capital | 0.83 | 0.83 | 0.79 | |
| Net Debt to EBITDA | 20.92 | 21.90 | 12.09 | |
| Current Ratio | 0.50 | 0.94 | 0.89 | |
| Quick Ratio | 0.93 | 0.94 | 0.89 | |
| Financial Leverage | 13.74 | 14.04 | 12.30 |
Goldman Sachs' leveraged position is relatively high, which might affect its maneuverability but should be weighed against the company's robust earnings and historical stability.
💪 Fundamental Strength & Profitability
Assessing profitability and inherent financial strengths provides a clear view of a company's efficiency in turning revenue into earnings, highlighting its potential to sustain competitive advantages and reward investments.
| Year | Metric | 2024 | 2023 | 2022 |
|---|---|---|---|---|
| Return on Equity | 0.12 | 0.07 | 0.10 | |
| Return on Assets | 0.01 | 0.01 | 0.01 | |
| Net Margin | 11.25% | 10.19% | 16.39% | |
| EBIT Margin | 14.50% | 9.91% | 19.63% | |
| EBITDA Margin | 16.39% | 14.38% | 23.20% | |
| Gross Margin | 41.12% | 41.71% | 64.98% | |
| R&D to Revenue | 0.00 | 0.00 | 0.00 |
With solid margins and return figures, Goldman Sachs showcases efficiency and strategic prowess in its operations. However, absence of dedicated R&D expenditures may be a concern for future innovation potential.
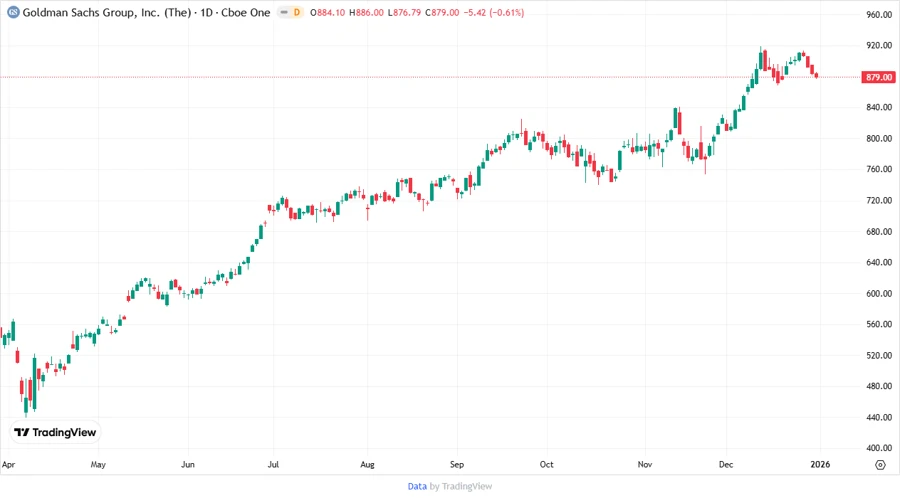
🔍 Price Development
🗣️ Dividend Scoring System
| Category | Score | Chart |
|---|---|---|
| Dividend yield | 3 | |
| Dividend Stability | 4 | |
| Dividend growth | 3 | |
| Payout ratio | 4 | |
| Financial stability | 4 | |
| Dividend continuity | 5 | |
| Cashflow Coverage | 3 | |
| Balance Sheet Quality | 3 |
Total Score: 29/40
✅ Rating
Goldman Sachs presents a solid profile for investors seeking stable dividends with gradual growth. Despite some leverage concerns, its sound dividend consistency, supported by manageable payout ratios, makes it an attractive investment choice for moderate-risk profiles looking to maintain income focused investments.