November 23, 2025 a 07:46 am

GS: Dividend Analysis - The Goldman Sachs Group, Inc.
Goldman Sachs, a distinguished entity in the financial sector, possesses an impressive dividend history spanning 27 years. Despite some challenges in the financial market, it continues to show a robust dividend policy with a consistent increase over recent years. The current dividend yield, combined with its growth rate, substantiates its appeal as a viable income-generating asset for investors.
📊 Overview
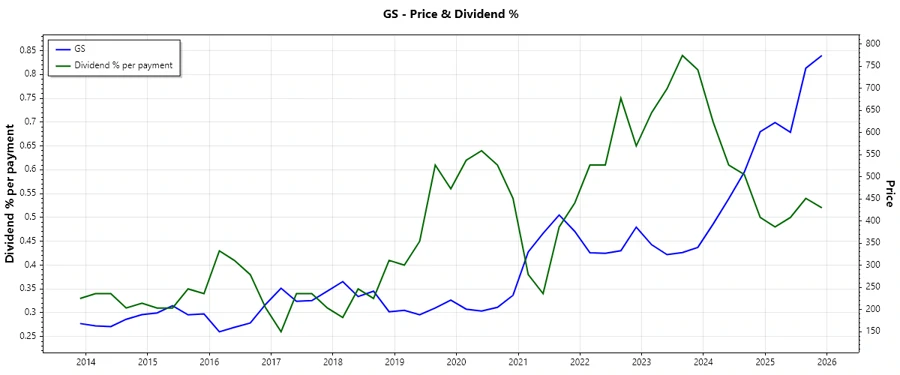
Goldman Sachs operates within the competitive financial sector. The company's commitment to returning value to shareholders is evident in its current dividend yield of 1.81%, paired with an annual dividend per share of $13.71. With a 27-year track record of dividend growth, its historical resilience is noteworthy. Importantly, the last dividend cut occurred in 2010, emphasizing over a decade of uninterrupted dividend stability.
| Metric | Value |
|---|---|
| Sector | Financials |
| Dividend yield | 1.81% |
| Current dividend per share | $13.71 |
| Dividend history | 27 years |
| Last cut or suspension | 2010 |
🗣️ Dividend History
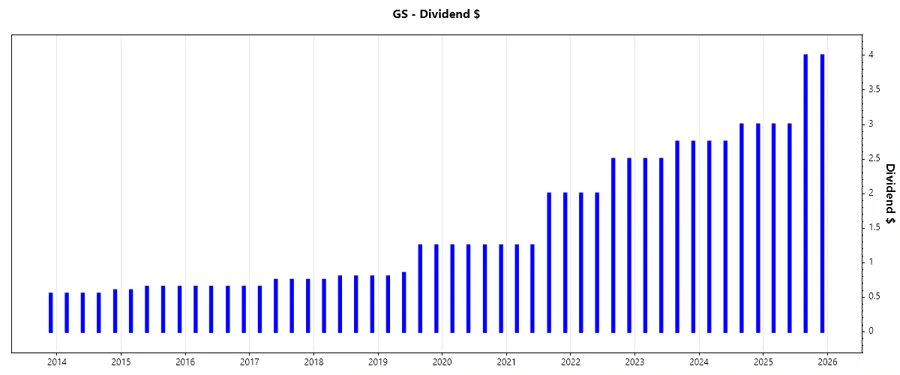
For income-focused investors, Goldman Sachs' dividend history is an emblem of reliability. A consistent uptrend in payment, reaching $14 per share in 2025, affirms strategic business decisions fostering growth despite financial vicissitudes.
| Year | Dividend Per Share (USD) |
|---|---|
| 2025 | $14.00 |
| 2024 | $11.50 |
| 2023 | $10.50 |
| 2022 | $9.00 |
| 2021 | $6.50 |
📈 Dividend Growth
Evaluating historical dividend growth is integral to understanding how Goldman Sachs navigates economic conditions to foster long-term shareholder value. With a 5-year growth rate at 22.61% and 3-year growth at 20.95%, the figures signify modest yet steady growth.
| Time | Growth |
|---|---|
| 3 years | 20.95% |
| 5 years | 22.61% |
The average dividend growth is 22.61% over 5 years. This shows moderate but steady dividend growth.
📉 Payout Ratio
The payout ratio is a critical indicator; for Goldman Sachs, the EPS-based payout ratio stands at an admirably sustainable 25.46%. On a free cash flow basis, the negative figure requires closer scrutiny due to capital allocation intricacies.
| Key Figure | Ratio |
|---|---|
| EPS-based | 25.46% |
| Free cash flow-based | -17.28% |
While the EPS payout ratio is prudent and conservative, allowing for future capital reinvestment, the negative FCF payout ratio suggests tighter cash flow, warranting monitoring.
✅ Cashflow & Capital Efficiency
Understanding the nuanced dynamics of cash flow and capital efficiency, particularly for a financial heavyweight like Goldman Sachs, requires attention. A negative free cash flow yield alongside a troublingly high net debt to EBITDA ratio highlights potential liquidity pressures.
| Metric | 2022 | 2023 | 2024 |
|---|---|---|---|
| Free Cash Flow Yield | 4.10% | -11.34% | -8.15% |
| Earnings Yield | 9.31% | 6.48% | 7.60% |
| CAPEX to Operating Cash Flow | 43.04% | 18.40% | -15.83% |
| Stock-based Compensation to Revenue | 5.94% | 1.92% | 2.10% |
| Free Cash Flow / Operating Cash Flow Ratio | 56.96% | 118.40% | 115.83% |
While the metrics indicate a mixed trend, highlighting fluctuations in cash flow and capital deployment efficiency, consistent earnings yield stands out as a positive. However, the negative cash flow situations denote an area in need of improvement.
⚠️ Balance Sheet & Leverage Analysis
Goldman Sachs' leverage ratios underscore its capital structure's complexity. Despite the elevated debt-to-equity ratio, indicative of high leverage, it's aligned with typical financial industry standards, albeit necessitating ongoing risk management.
| Metric | 2022 | 2023 | 2024 |
|---|---|---|---|
| Debt-to-Equity | 370.81% | 498.81% | 505.70% |
| Debt-to-Assets | 30.14% | 35.52% | 36.81% |
| Debt-to-Capital | 78.76% | 83.30% | 83.49% |
| Net Debt to EBITDA | 12.09 | 21.90 | 20.92 |
| Current Ratio | 89.38% | 93.66% | 92.64% |
| Quick Ratio | 89.38% | 93.66% | 92.64% |
| Financial Leverage | 12.30 | 14.04 | 13.74 |
While Goldman Sachs presents robust financial metrics, the substantial leverage and debt levels necessitate continuous focus to maintain liquidity and mitigate financial risks, positioning strategic debt management as a pivotal priority.
🔍 Fundamental Strength & Profitability
Examining fundamental strength, key profitability ratios such as Return on Equity (ROE) demonstrate Goldman Sachs' efficiency in generating returns on existing equity capital. Despite fluctuations, a healthy ROE suggests profitable operational performance.
| Metric | 2022 | 2023 | 2024 |
|---|---|---|---|
| Return on Equity | 9.61% | 7.28% | 11.70% |
| Return on Assets | 0.78% | 0.52% | 0.85% |
| Net Margin | 16.39% | 7.85% | 11.25% |
| EBIT Margin | 19.63% | 9.91% | 14.50% |
| EBITDA Margin | 23.20% | 14.38% | 16.39% |
| Gross Margin | 64.98% | 41.71% | 41.12% |
| R&D to Revenue | 0.00% | 0.00% | 0.00% |
Sustained profitability metrics affirm operational efficiency and strategic management. However, the integration of R&D could further enhance competitive positioning amidst the evolving financial landscape.
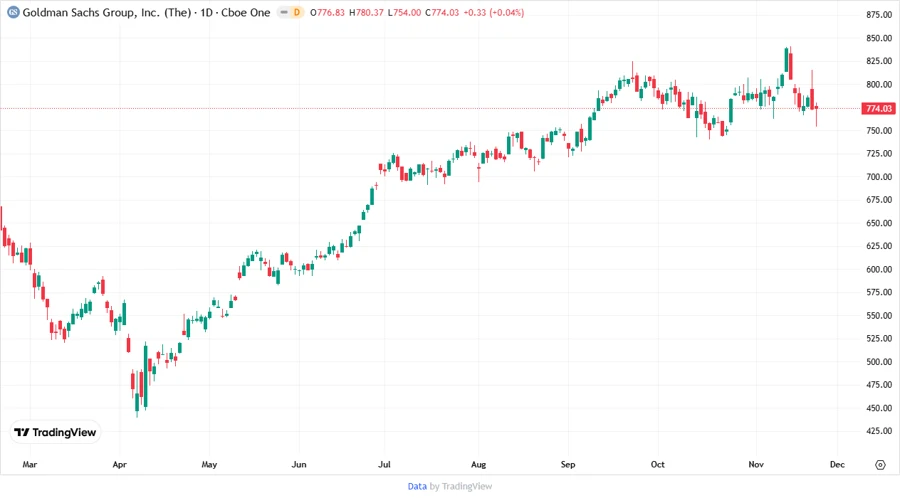
Price Development
🔢 Dividend Scoring System
| Criteria | Score | |
|---|---|---|
| Dividend yield | 3 | |
| Dividend Stability | 4 | |
| Dividend growth | 4 | |
| Payout ratio | 5 | |
| Financial stability | 3 | |
| Dividend continuity | 5 | |
| Cashflow Coverage | 3 | |
| Balance Sheet Quality | 2 |
Total Score: 29/40
✅ Rating
Goldman Sachs presents a compelling profile with strong dividend continuity, consistent dividend growth, and prudent payout ratios. Despite inherent liquidity challenges typical in the financial sector, its strategic planning supports an overall BUY recommendation for income-focused investors seeking stable and potentially growing dividends over time.