October 25, 2025 a 08:15 am


GRMN: Trend and Support & Resistance Analysis - Garmin Ltd.
Garmin Ltd., known for its innovative wireless devices across several segments, has shown recent market fluctuations. Technical analysis indicates the emerging trends for the company's stock prices. Analyzing the support and resistance levels will provide further insights into potential market behavior.
Trend Analysis
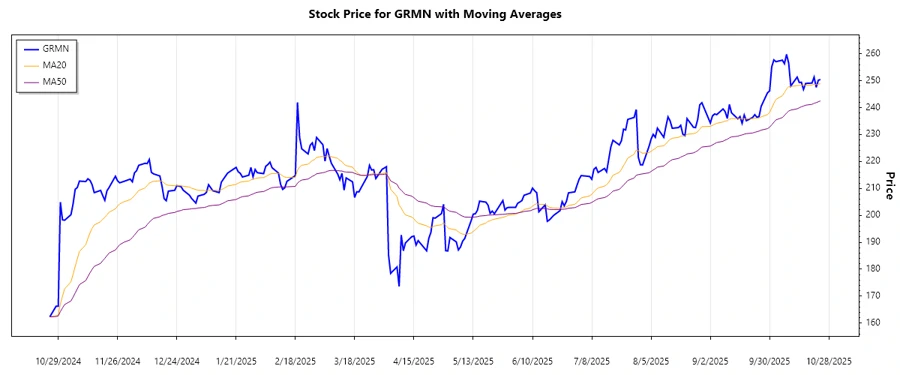
Recent price data over the past months for Garmin Ltd. reveals significant trends. Using the EMA20 and EMA50 indicators, we notice:
| Date | Close Price | Trend |
|---|---|---|
| 2025-10-24 | $250.45 | ▲ (Bullish) |
| 2025-10-23 | $250.17 | ▲ (Bullish) |
| 2025-10-22 | $247.55 | ▲ (Bullish) |
| 2025-10-21 | $251.34 | ▲ (Bullish) |
| 2025-10-20 | $249.13 | ▲ (Bullish) |
| 2025-10-17 | $248.99 | ▲ (Bullish) |
| 2025-10-16 | $246.74 | ▲ (Bullish) |
The EMA20 is currently above the EMA50, indicating a strong bullish trend. Investors should perceive this trend as a signal of potential growth, although monitoring for changes in momentum is advisable.
Support and Resistance
Technical analysis to identify support and resistance levels for Garmin Ltd. provides key zones:
| Zone Type | From | To |
|---|---|---|
| Support 1 | $236.00 | $238.00 |
| Support 2 | $245.00 | $247.00 |
| Resistance 1 | $251.00 | $253.00 |
| Resistance 2 | $258.00 | $260.00 |
The recent closing price is within the first support zone, suggesting potential buying interest around these levels. Traders should watch if the price breaks through or bounces off these levels for further actions.
Conclusion
The analysis reveals a strong bullish bias currently present in Garmin Ltd.'s stock price. Investors must consider the technical indicators signaling an uptrend, while closely monitoring support and resistance levels for potential breakout or reversal opportunities. The stock is positioned interestingly, warranting attention for both the continuation of its momentum and its potential to counter existing resistance.
Smart Data Insight
Master the Perfect Entry & Exit for this Stock
Don't leave your profits to chance. Historically, this stock follows specific seasonal patterns that institutional traders use to maximize returns.
- ✅ Identify the "Golden Buying Window"
- ✅ Avoid high-risk correction cycles
- ✅ Backtested data from the last 20+ years