October 07, 2025 a 04:04 am
GRMN: Trend and Support & Resistance Analysis - Garmin Ltd.
Garmin Ltd. has shown substantial price movement indicating significant investor interest in its stock. With its strong foothold in the technology sector, the company's diverse range of products offers it the flexibility to leverage across various market segments. Current technical indicators signal potential opportunities for bullish investors as the stock has maintained a steady upward trajectory. However, continued market volatility and sector competition could pose risks. For short to medium-term investors, monitoring the support and resistance levels could be key to making informed decisions.
Trend Analysis
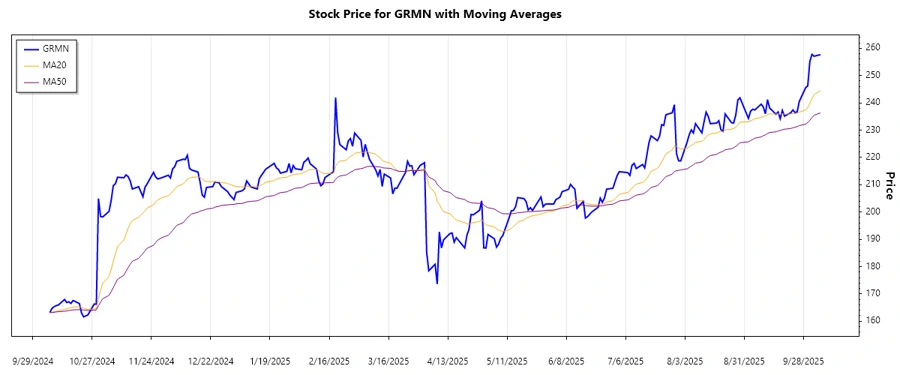
Upon analyzing the historical data of Garmin Ltd. (GRMN), it's evident that the recently observed trend is upward, showing a significant recovery from earlier dips. The exponential moving averages (EMA) were calculated to determine the trend: EMA20 was consistently above EMA50 indicating a strong bullish sentiment among investors.
| Date | Closing Price | Trend Direction |
|---|---|---|
| 2025-10-06 | 257.64 | ▲ |
| 2025-10-03 | 257.06 | ▲ |
| 2025-10-02 | 257.74 | ▲ |
| 2025-10-01 | 255.18 | ▲ |
| 2025-09-30 | 246.22 | ▲ |
| 2025-09-29 | 245.53 | ▲ |
| 2025-09-26 | 240.48 | ▲ |
The upward trend indicates promising growth potential as investors have been showing increased confidence, driving the prices upward. Such trends are generally favorable for long positions.
Support and Resistance
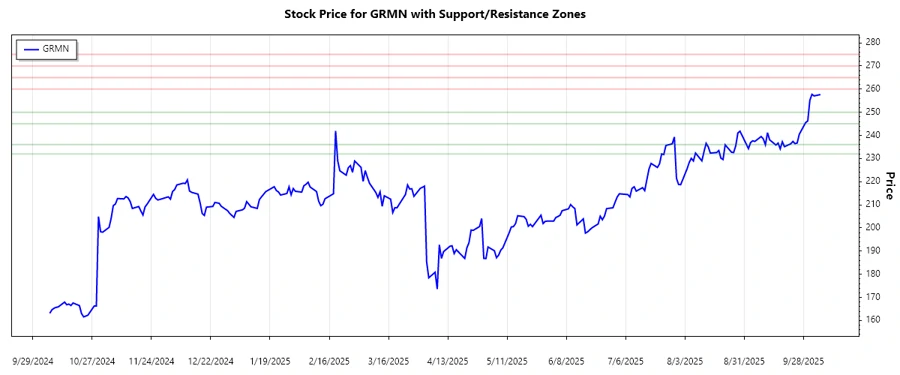
The analysis of support and resistance levels reveals key zones where the stock price could be anticipated to pause or reverse. Calculations have identified strong support and resistance areas.
| Zone Type | From | To | |
|---|---|---|---|
| Support | 232 | 236 | ⬇ |
| Support | 245 | 250 | ⬇ |
| Resistance | 260 | 265 | ⬆ |
| Resistance | 270 | 275 | ⬆ |
Currently, the stock price is positioned just above the primary support zone (232-236), indicating a potential base for upward movement. This scenario generally aligns with bullish anticipations.
Conclusion
Garmin Ltd. continues to exhibit a promising technical landscape marked by a pronounced uptrend. With EMA20 maintaining its position above EMA50, the bullish trend provides a positive backdrop. However, investors must remain vigilant of the potent resistance near 260 and 270 levels, which could act as critical barriers. Support levels present a potential safety net fortifying the downside. Strategically, taking positions aligned with the upward momentum while monitoring near critical zones is advisable. Nonetheless, the risk of sector-specific headwinds should be considered.
Smart Data Insight
Master the Perfect Entry & Exit for this Stock
Don't leave your profits to chance. Historically, this stock follows specific seasonal patterns that institutional traders use to maximize returns.
- ✅ Identify the "Golden Buying Window"
- ✅ Avoid high-risk correction cycles
- ✅ Backtested data from the last 20+ years