September 22, 2025 a 01:15 pm
GRMN: Trend and Support & Resistance Analysis - Garmin Ltd.
Garmin Ltd. has experienced varied fluctuations in its stock price, reflecting changes in market conditions and investor sentiments over the observed months. The analysis based on technical indicators shows significant zones of resistance and support, providing insights into possible future price movements. Understanding these levels can help investors strategize their investment activities better. Garmin's presence across diverse segments—from fitness to aviation—might act as a stabilizing factor against volatile market conditions.
Trend Analysis
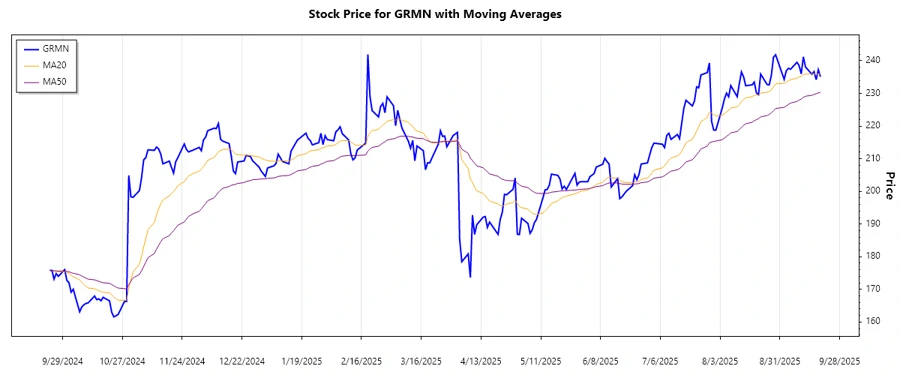
Over the past months, Garmin Ltd.'s stock prices show a notable upward trend, particularly identified in its later stages. Calculating the Exponential Moving Averages (EMA) for 20 and 50 days from closing prices reveals the recent trend dynamics.
| Date | Close Price | Trend Direction |
|---|---|---|
| 2025-09-19 | 235.12 | ▲ Upward |
| 2025-09-18 | 237.25 | ▲ Upward |
| 2025-09-17 | 234.18 | ▼ Downward |
| 2025-09-16 | 236.67 | ▲ Upward |
| 2025-09-15 | 235.83 | ▲ Upward |
| 2025-09-12 | 238.08 | ▲ Upward |
| 2025-09-11 | 241.18 | ▲ Upward |
The EMA20 is consistently above the EMA50, which indicates a dominant upward trend. This reflects positive investor sentiment and potential bullish momentum.
Support and Resistance
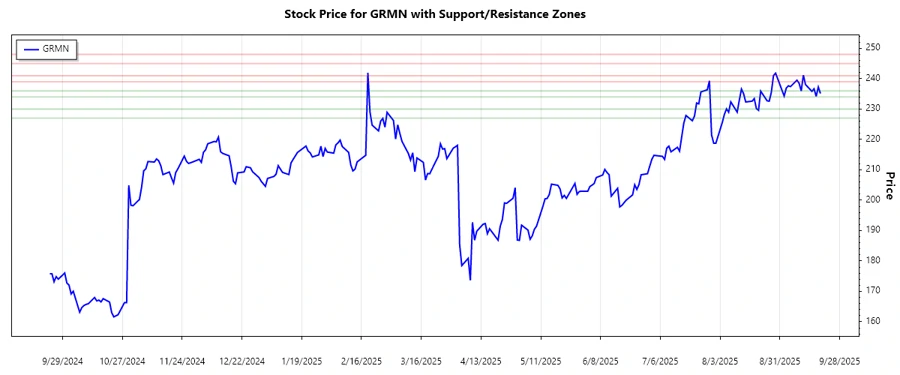
An analysis of the price movements around key psychological levels reveals pivotal support and resistance zones. These can be instrumental for traders in identifying entry and exit points.
| Zone Type | Range From | Range To |
|---|---|---|
| Support Zone 1 | 227.00 | 230.00 |
| Support Zone 2 | 234.00 | 236.00 |
| Resistance Zone 1 | 239.00 | 241.00 |
| Resistance Zone 2 | 245.00 | 248.00 |
The current price is hovering within the first resistance zone, suggesting a possible challenge to break through and sustain higher levels. This may act as a ceiling in the short term unless strong upward momentum is sustained.
Conclusion
Garmin Ltd.'s stock demonstrates a clear upward trend with potential bullish momentum. The presence in key support zones might limit downside risks, whereas resistance levels highlight potential barriers to watch for further gains. Investors should be mindful of these technical levels when strategizing their trades. In the broader context, the varied business segments of Garmin lend an underlying stability, although external market factors could introduce volatility. Monitoring the trend and reacting to technical signals can facilitate balanced investment decisions.
Smart Data Insight
Master the Perfect Entry & Exit for this Stock
Don't leave your profits to chance. Historically, this stock follows specific seasonal patterns that institutional traders use to maximize returns.
- ✅ Identify the "Golden Buying Window"
- ✅ Avoid high-risk correction cycles
- ✅ Backtested data from the last 20+ years