
November 02, 2025 a 01:00 pm
GRMN: Fundamental Ratio Analysis - Garmin Ltd.
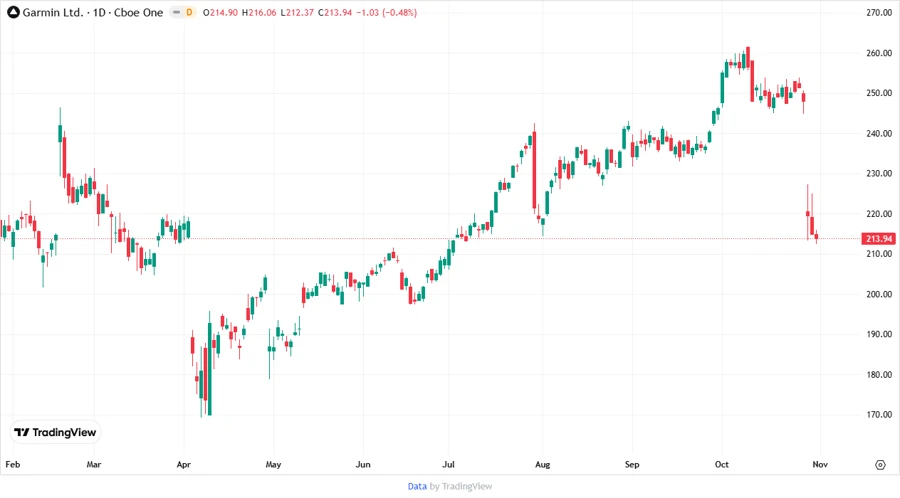
Garmin Ltd. is a global leader in providing innovative GPS technology across diverse markets, including aviation, marine, fitness, and outdoor recreation. The company's commitment to innovation is backed by robust financial health and strategic market positioning. Investors are encouraged to consider the potential for growth amidst dynamic market conditions and technological advancements.
Fundamental Rating
Garmin exhibits a strong fundamental performance supported by several key financial metrics, indicating a stable position in the technology sector.
| Category | Score | Visualization |
|---|---|---|
| Discounted Cash Flow (DCF) | 3 | |
| Return on Equity (ROE) | 4 | |
| Return on Assets (ROA) | 5 | |
| Debt to Equity | 3 | |
| Price to Earnings (P/E) | 2 | |
| Price to Book (P/B) | 2 |
Historical Rating
The company's historical performance reflects consistent scores across key financial metrics, providing insight into its stable fiscal management over time.
| Date | Overall | DCF | ROE | ROA | Debt/Equity | P/E | P/B |
|---|---|---|---|---|---|---|---|
| 2025-10-31 | 3 | 3 | 4 | 5 | 3 | 2 | 2 |
| Previous | 0 | 3 | 4 | 5 | 3 | 2 | 2 |
Analyst Price Targets
Analysts suggest a balanced outlook with a median target price pointing towards potential stability in Garmin's stock price.
| High | Low | Median | Consensus |
|---|---|---|---|
| $305 | $193 | $208 | $235.33 |
Analyst Sentiment
The current analyst sentiment shows a majority holding position, indicating a cautious yet stable forecast for the company.
| Recommendation | Count | Visualization |
|---|---|---|
| Strong Buy | 1 | |
| Buy | 4 | |
| Hold | 19 | |
| Sell | 4 | |
| Strong Sell | 0 |
Conclusion
Garmin Ltd.'s strong presence across multiple market segments positions it favorably for continued growth. The company's financial stability is highlighted by strong ROA and ROE metrics. However, moderate price-to-earnings and price-to-book ratios signal caution. While the stock holds a 'Hold' consensus from analysts, upside potential exists if Garmin continues to enhance its product offerings and capitalize on emerging market trends. Investors should weigh the reasonably steady performance against market volatility and competitive pressures.
Smart Data Insight
Master the Perfect Entry & Exit for this Stock
Don't leave your profits to chance. Historically, this stock follows specific seasonal patterns that institutional traders use to maximize returns.
- ✅ Identify the "Golden Buying Window"
- ✅ Avoid high-risk correction cycles
- ✅ Backtested data from the last 20+ years