March 06, 2026 a 03:15 pm
GRMN: Fibonacci Analysis - Garmin Ltd.
Garmin Ltd., a leading manufacturer in the wireless devices sector, has shown a dynamic movement in its stock price over recent months. The company's diverse portfolio, which spans fitness, auto, marine, aviation, and outdoor segments, provides a stable revenue stream, yet the market conditions have impacted its share price. A careful analysis of the recent price trends may help investors identify potential entry and exit points.
Fibonacci Analysis
| Property | Value |
|---|---|
| Trend Start Date | 2025-04-08 |
| Trend End Date | 2026-03-06 |
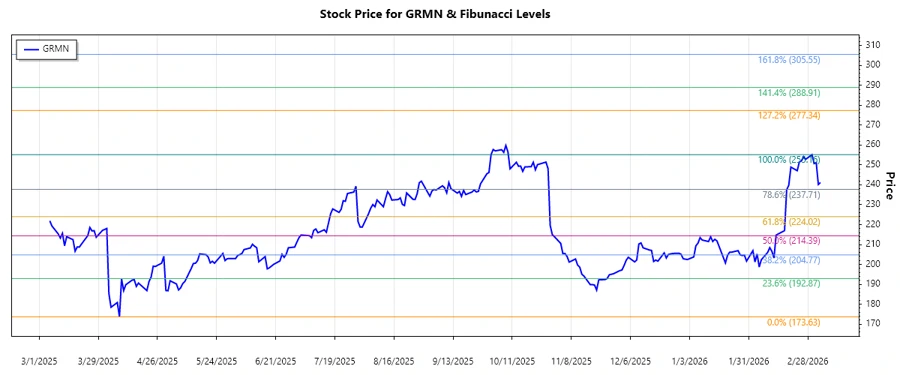
| Highest Price | $255.16 on 2026-03-02 |
| Lowest Price | $173.63 on 2025-04-08 |
Fibonacci Retracement Levels
| Level | Price |
|---|---|
| 0.236 | $200.53 |
| 0.382 | $216.75 |
| 0.5 | $229.39 |
| 0.618 | $242.03 |
| 0.786 | $255.79 |
The current price of $241.19 is within the 0.618 retracement level zone, suggesting potential resistance. This level could serve as a pivotal point where the market decides to continue the uptrend or reverses.
Conclusion
Overall, the Garmin Ltd stock has showcased a significant uptrend, reflecting investor confidence in its business model and growth potential. The positioning at the 0.618 Fibonacci retracement level suggests a focal area for potential market decisions which might imply upcoming resistance. However, should the stock price break through this level, it could instigate further bullish sentiment. Analysts should closely monitor these key levels as they hold significant implications for future price movements. Nevertheless, investors should be mindful of external market conditions that could impact the stock's trajectory. Balancing the stock’s intrinsic stability with external market volatility will be key.