June 24, 2025 a 03:15 pm

GRMN: Fibonacci Analysis - Garmin Ltd.
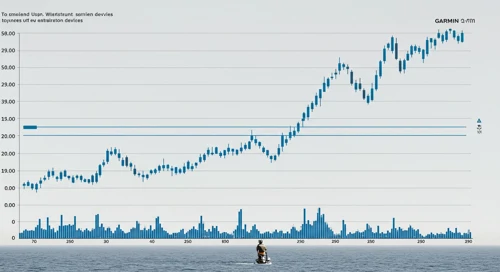
Garmin Ltd. has shown a dynamic performance characterized by significant fluctuations in its stock price over the past months. Recently, the stock has been on a notable downward trend, possibly influenced by external market factors or internal company developments. Investors should note the technical signals and strategic positioning as they consider potential entry points or exit strategies in this volatile context.
Fibonacci Analysis
| Element | Details |
|---|---|
| Analysis Period | 2025-02-19 to 2025-06-24 |
| High Point | 241.93 on 2025-02-19 |
| Low Point | 186.78 on 2025-05-01 |
Fibonacci Retracement Levels
| Level | Price |
|---|---|
| 0.236 | 227.02 |
| 0.382 | 218.39 |
| 0.5 | 214.36 |
| 0.618 | 210.33 |
| 0.786 | 203.10 |
Currently, the stock price is approximately 202.9, which places it near the 0.786 retracement level. This position suggests that the stock may be facing potential support around this area, which could lead to a consolidation phase or a bounce back if buyers perceive value at this level.
Conclusion
Garmin Ltd.'s stock exhibits challenging downtrend characteristics, reflecting broader market sentiments or company-specific adjustments. The presence near a critical Fibonacci level denotes potential investment opportunities or risks associated with further declines if support fails. For analysts, this situation warrants close monitoring of volume and market behaviors as signals for potential reversals or the continuation of the downward trajectory. Such insights are crucial for advising both short-term trades and longer-term investment outlooks.
Smart Data Insight
Master the Perfect Entry & Exit for this Stock
Don't leave your profits to chance. Historically, this stock follows specific seasonal patterns that institutional traders use to maximize returns.
- ✅ Identify the "Golden Buying Window"
- ✅ Avoid high-risk correction cycles
- ✅ Backtested data from the last 20+ years