February 09, 2026 a 07:46 am
GRMN: Dividend Analysis - Garmin Ltd.
Garmin Ltd. exhibits a stable and attractive dividend profile, offering a steady dividend yield while maintaining a consistent growth rate. The company demonstrates a strong financial health backed by robust revenue streams, making it a viable option for dividend-focused investors. With diversified operations within the technology sector, Garmin's dividends are supported by significant free cash flow and moderate payout ratios.
📊 Overview
Garmin Ltd. operates within the technology sector, boasting a dividend yield of 1.78%. The current dividend per share stands at 2.98 USD, with a commendable 24-year dividend history highlighting reliability. There have been no recent cuts or suspensions, underscoring dividend stability.
| Metric | Value |
|---|---|
| Sector | Technology |
| Dividend yield | 1.78% |
| Current dividend per share | 2.98 USD |
| Dividend history | 24 years |
| Last cut or suspension | None |
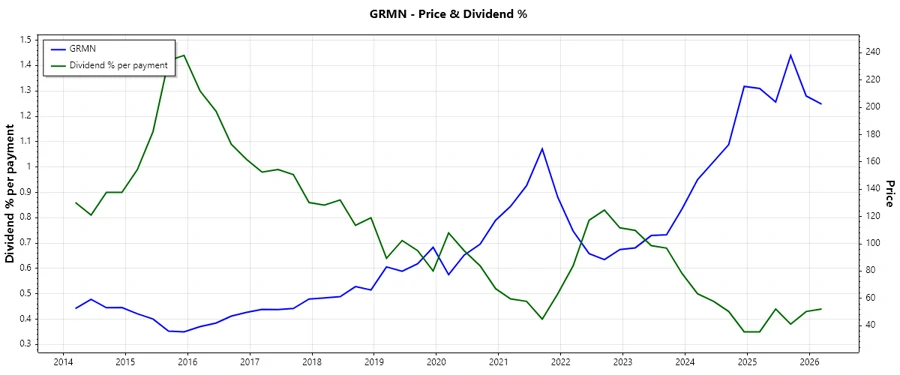
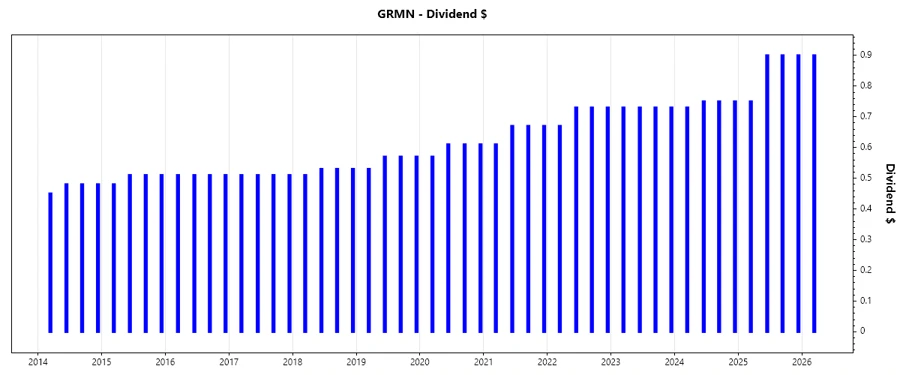
🗣️ Dividend History
Garmin's extensive dividend history showcases a pattern of increases, indicative of its commitment to returning value to shareholders. This historical consistency is vital for calculating risk and assessing long-term investment viability.
| Year | Dividend per Share (USD) |
|---|---|
| 2026 | 0.90 |
| 2025 | 3.45 |
| 2024 | 2.98 |
| 2023 | 2.92 |
| 2022 | 2.86 |
📈 Dividend Growth
The growth trajectory of Garmin's dividends over both short and mid-term periods indicates strong management performance and an effective shareholder value approach. This pattern of growth strengthens investor confidence and adds to the overall investment rationale.
| Time | Growth |
|---|---|
| 3 years | 6.45% |
| 5 years | 7.53% |
The average dividend growth is 7.53% over 5 years. This shows moderate but steady dividend growth.
✅ Payout Ratio
The payout ratios provide insights into the company's ability to sustain its dividend payments. Garmin showcases a sustainable balance between earnings and free cash flow coverage, which bodes well for the continuation of its dividend policy.
| Key figure | Ratio |
|---|---|
| EPS-based | 36.50% |
| Free cash flow-based | 43.00% |
The payout ratio of 36.50% (EPS) and 43.00% (FCF) implies prudent financial management, ensuring dividends are well-covered by the company's profits and cash flow, securing potential future payouts.
⚙️ Cashflow & Capital Efficiency
Assessing cash flow and capital efficiency ratios is essential for determining the financial flexibility and sustainability of a dividend policy. Garmin demonstrates resilience in maintaining a strong free cash flow yield and efficient capital management, crucial for enduring dividend strategies.
| Year | 2024 | 2023 | 2022 |
|---|---|---|---|
| Free Cash Flow Yield | 3.08% | 4.80% | 3.05% |
| Earnings Yield | 3.51% | 5.24% | 5.48% |
| CAPEX to Operating Cash Flow | 13.51% | 14.17% | 31.23% |
| Stock-based Compensation to Revenue | 2.18% | 1.94% | 1.58% |
| Free Cash Flow / Operating Cash Flow Ratio | 86.49% | 85.83% | 68.77% |
Garmin's performance indicates a strong capacity to generate cash flow from operations while efficiently managing capital expenditures and stock-based compensation.
🛡️ Balance Sheet & Leverage Analysis
Evaluating the balance sheet metrics reveals Garmin's low leverage levels and strong liquidity ratios, promising stability and reduced risk for dividend payments. The company effectively manages its debt, minimizing financial distress concerns.
| Year | 2024 | 2023 | 2022 |
|---|---|---|---|
| Debt-to-Equity | 2.07% | 1.61% | 1.85% |
| Debt-to-Assets | 1.69% | 1.31% | 1.48% |
| Debt-to-Capital | 2.03% | 1.59% | 1.81% |
| Net Debt to EBITDA | -1.08 | -1.24 | -0.98 |
| Current Ratio | 0.00 | 3.41 | 3.26 |
| Quick Ratio | 2.56 | 2.38 | 2.01 |
| Financial Leverage | 1.23 | 1.23 | 1.25 |
Garmin's balance sheet reflects prudent management of leverage and enhances the company's capacity to sustain its dividend payments over the long term.
🎯 Fundamental Strength & Profitability
Garmin's strong returns on equity and assets, alongside healthy profit margins across multiple metrics, illustrate operational excellence and a solid foundation for supporting dividend payouts.
| Year | 2024 | 2023 | 2022 |
|---|---|---|---|
| Return on Equity | 17.98% | 18.39% | 15.69% |
| Return on Assets | 14.66% | 14.99% | 12.59% |
| Margins: Net | 22.41% | 24.67% | 20.03% |
| Margins: EBIT | 25.31% | 20.89% | 21.15% |
| Margins: EBITDA | 28.17% | 24.29% | 24.52% |
| Margins: Gross | 58.70% | 57.48% | 57.75% |
| R&D to Revenue | 15.68% | 17.30% | 17.18% |
Garmin leverages its strong fundamental strength and profitability to maintain competitive advantages and drive shareholder value through consistent dividend distributions.
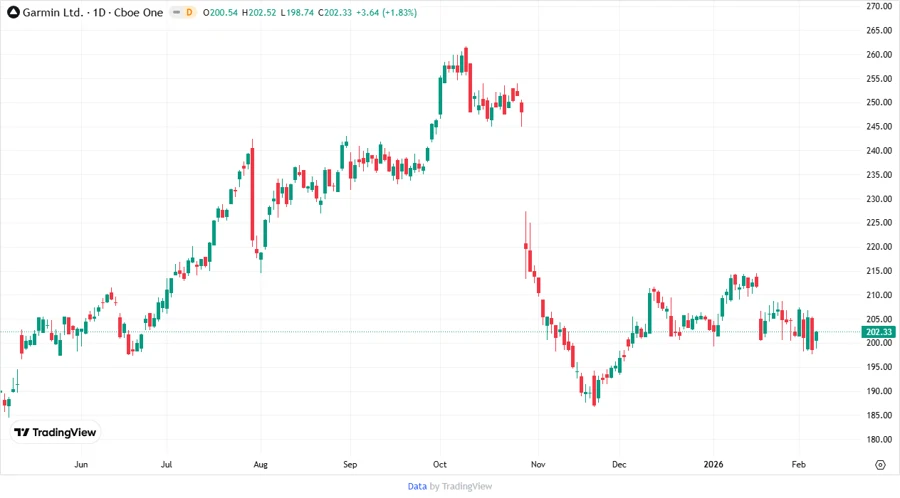
🔄 Price Development
📊 Dividend Scoring System
| Category | Rating | Score |
|---|---|---|
| Dividend yield | 4 | |
| Dividend Stability | 5 | |
| Dividend growth | 4 | |
| Payout ratio | 4 | |
| Financial stability | 5 | |
| Dividend continuity | 5 | |
| Cashflow Coverage | 4 | |
| Balance Sheet Quality | 5 |
Overall Score: 36/40
🌟 Rating
Garmin Ltd. is a robust choice for dividend investors seeking stability and moderate growth. The company's strategic dividends backed by strong fundamentals make it a compelling portfolio addition, with a recommendation to Hold for consistent income generation.
Smart Data Insight
Master the Perfect Entry & Exit for this Stock
Don't leave your profits to chance. Historically, this stock follows specific seasonal patterns that institutional traders use to maximize returns.
- ✅ Identify the "Golden Buying Window"
- ✅ Avoid high-risk correction cycles
- ✅ Backtested data from the last 20+ years