November 18, 2025 a 03:31 pm


GRMN: Dividend Analysis - Garmin Ltd.
Garmin Ltd. continues to demonstrate resilience with its consistent dividend strategy and significant market presence. The company's robust financial health is epitomized by its sustainable payout ratios and prudent capital allocation, ensuring a reliable income stream for shareholders. However, the recent cut in 2026 signals the necessity for careful analysis of future outlooks.
📊 Overview
This section provides a snapshot of Garmin Ltd.'s dividend landscape and sector positioning.
| Metric | Value |
|---|---|
| Sector | Technology |
| Dividend Yield | 1.90% |
| Current Dividend per Share | 2.98 USD |
| Dividend History | 24 years |
| Last Cut or Suspension | 2026 |
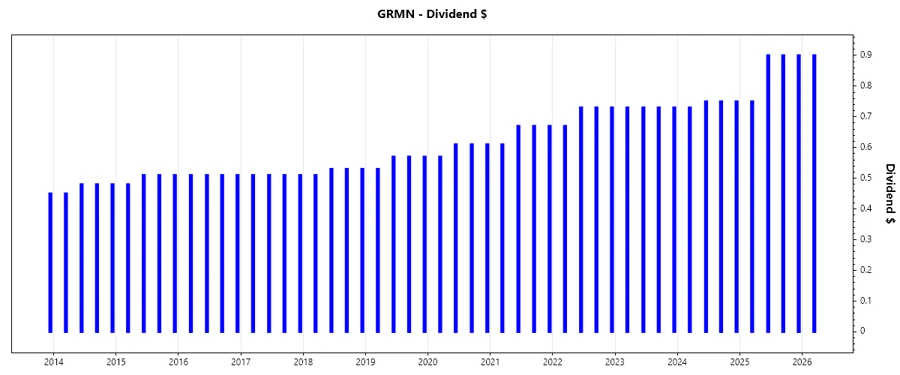
🗣️ Dividend History
Garmin Ltd. boasts a strong history of dividend payments, reflecting its long-term commitment to shareholders. Such consistency is instrumental for income-focused investors, indicating reliability even during market volatility.
| Year | Dividend per Share (USD) |
|---|---|
| 2026 | 0.9 |
| 2025 | 3.45 |
| 2024 | 2.98 |
| 2023 | 2.92 |
| 2022 | 2.86 |
📈 Dividend Growth
A positive trajectory in dividend growth is indicative of a company's profitability and cash flow augmentation. Garmin's performance in this regard emphasizes its capacity to enhance shareholder value over time.
| Time | Growth |
|---|---|
| 3 years | 4.39% |
| 5 years | 5.88% |
The average dividend growth is 5.88% over 5 years. This shows moderate but steady dividend growth.
📉 Payout Ratio
Assessment of payout ratios provides insight into the sustainability of Garmin's dividend policy. The current balances between earnings and cash flow distributions indicate a well-managed dividend strategy.
| Key figure | Ratio |
|---|---|
| EPS-based | 36.50% |
| Free cash flow-based | 43.01% |
The payout ratio of 36.50% (EPS) and 43.01% (FCF) showcases Garmin's disciplined capital management, leaving room for reinvestments and dividend growth.
✅ Cashflow & Capital Efficiency
Strong cash flow and capital utilization metrics are tell-tale signs of a company's operational effectiveness. Garmin's cash flow and capital metrics demonstrate its commitment to efficient resource management, vital for maintaining liquidity positions and funding cyclical operational needs.
| Metric | 2022 | 2023 | 2024 |
|---|---|---|---|
| Free Cash Flow Yield | 3.05% | 4.80% | 3.08% |
| Earnings Yield | 5.48% | 5.24% | 3.51% |
| CAPEX to Operating Cash Flow | 31.23% | 14.17% | 13.51% |
| Stock-based Compensation to Revenue | 1.58% | 1.94% | 2.18% |
| Free Cash Flow / Operating Cash Flow Ratio | 68.77% | 85.83% | 86.49% |
Garmin's results show a significant balance in cash preservation and reinvestment capabilities, critical for its long-term strategic vision.
🗣️ Balance Sheet & Leverage Analysis
A strong balance sheet is crucial for financial resilience. Garmin's leverage ratios and liquidity metrics signify its sound fiscal health, offering a buffer against economic uncertainty.
| Metric | 2022 | 2023 | 2024 |
|---|---|---|---|
| Debt-to-Equity | 1.85% | 1.61% | 2.07% |
| Debt-to-Assets | 1.48% | 1.31% | 1.69% |
| Debt-to-Capital | 1.81% | 1.59% | 2.03% |
| Net Debt to EBITDA | -0.98 | -1.24 | -1.08 |
| Current Ratio | 3.26 | 3.41 | 3.54 |
| Quick Ratio | 2.01 | 2.38 | 2.56 |
| Financial Leverage | 1.25 | 1.23 | 1.23 |
Garmin maintains an admirable financial profile with prudent use of leverage, facilitating agile responses to market fluctuations.
✅ Fundamental Strength & Profitability
Examining foundational performance metrics offers insight into Garmin's operational efficiency and market competitiveness.
| Metric | 2022 | 2023 | 2024 |
|---|---|---|---|
| Return on Equity | 15.69% | 18.39% | 17.98% |
| Return on Assets | 12.59% | 14.99% | 14.66% |
| Margins: Net | 20.03% | 24.67% | 22.41% |
| Margins: EBIT | 21.15% | 20.89% | 25.31% |
| R&D to Revenue | 17.18% | 17.30% | 15.78% |
Garmin's steady ROE and margins underscore its ability to capitalize on growth opportunities while maintaining rigorous cost efficiency.
📈 Price Development
🔍 Dividend Scoring System
| Criteria | Score | Score Bar |
|---|---|---|
| Dividend Yield | 3 | |
| Dividend Stability | 4 | |
| Dividend Growth | 4 | |
| Payout Ratio | 5 | |
| Financial Stability | 5 | |
| Dividend Continuity | 4 | |
| Cashflow Coverage | 5 | |
| Balance Sheet Quality | 5 |
Overall Score: 35/40
🔍 Rating
In conclusion, Garmin Ltd. presents a robust investment opportunity with its demonstrated commitment to dividend stability and growth. The company maintains a solid financial foundation, fostering confidence in its long-term value proposition for conservative and income-focused investors.
Smart Data Insight
Master the Perfect Entry & Exit for this Stock
Don't leave your profits to chance. Historically, this stock follows specific seasonal patterns that institutional traders use to maximize returns.
- ✅ Identify the "Golden Buying Window"
- ✅ Avoid high-risk correction cycles
- ✅ Backtested data from the last 20+ years