December 21, 2025 a 04:44 pm**GPN: Fibonacci Analysis - Global Payments Inc.**
 **Fibonacci Analysis**
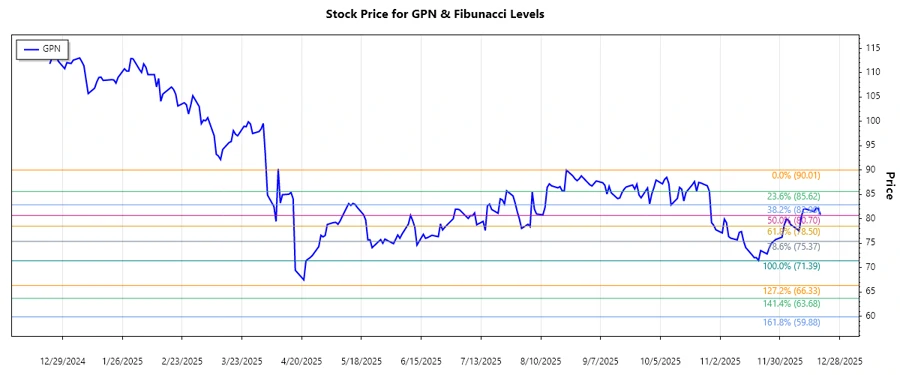
Based on the recent data analysis, Global Payments Inc. (GPN) has experienced a dominant downward trend.
- **Trend Period**: August 22, 2025 - December 19, 2025
- **High Point**: $90.01 on August 22, 2025
- **Low Point**: $71.39 on April 22, 2025
The Fibonacci Retracement Levels are calculated as follows:
**Fibonacci Analysis**
Based on the recent data analysis, Global Payments Inc. (GPN) has experienced a dominant downward trend.
- **Trend Period**: August 22, 2025 - December 19, 2025
- **High Point**: $90.01 on August 22, 2025
- **Low Point**: $71.39 on April 22, 2025
The Fibonacci Retracement Levels are calculated as follows:
The current price is $80.85, which places it within the 0.5 retracement zone. From a technical perspective, this level could serve as a potentially significant support or resistance area, as it indicates a pivotal point in market momentum.
 **Conclusion**
In conclusion, while the GPN stock price has shown a bearish trend over the past months, reaching the 0.5 Fibonacci retracement zone suggests a period of potential stabilization or reversal. For investors, this level might offer a buying opportunity, particularly if the stock breaks above resistance levels or positive news aligns. However, the persistent competition and risks associated with the payment industry mean that caution is warranted, and it is essential to consider macroeconomic conditions and company-specific developments when making investment decisions.
**Conclusion**
In conclusion, while the GPN stock price has shown a bearish trend over the past months, reaching the 0.5 Fibonacci retracement zone suggests a period of potential stabilization or reversal. For investors, this level might offer a buying opportunity, particularly if the stock breaks above resistance levels or positive news aligns. However, the persistent competition and risks associated with the payment industry mean that caution is warranted, and it is essential to consider macroeconomic conditions and company-specific developments when making investment decisions.
Over the past several months, the stock of Global Payments Inc. (GPN) has shown a downward trend, reflecting the challenges the company faces in its competitive industry. Financial metrics suggest caution, as recent earnings reports have not met market expectations. Analysts remain wary of potential strategic missteps and increased competition in payment solutions. However, value-driven investors might find opportunities, as the stock is priced lower compared to historical highs.
| Level | Price |
|---|---|
| 0.236 | $76.06 |
| 0.382 | $78.51 |
| 0.5 | $80.70 |
| 0.618 | $82.89 |
| 0.786 | $86.03 |
**Conclusion**
In conclusion, while the GPN stock price has shown a bearish trend over the past months, reaching the 0.5 Fibonacci retracement zone suggests a period of potential stabilization or reversal. For investors, this level might offer a buying opportunity, particularly if the stock breaks above resistance levels or positive news aligns. However, the persistent competition and risks associated with the payment industry mean that caution is warranted, and it is essential to consider macroeconomic conditions and company-specific developments when making investment decisions.