
June 14, 2026 a 03:30 am

📊 GPN: Dividend Analysis - Global Payments Inc.
Global Payments Inc. is a stalwart in the payment solutions industry with a storied dividend history spanning over two decades. Its moderate risk profile, combined with steady revenue streams, positions GPN as a reliable choice for long-term dividend investors. However, recent financial metrics, particularly in terms of earnings, call for a critical examination of its future dividend sustainability.
🗣️ Overview
Global Payments Inc. operates in the technology sector and has a respectable dividend yield of 1.48% as of the latest data. With a current dividend of $0.99 per share and a strong history of 26 years of dividend payments, the company showcases its commitment to shareholders. Notably, there have been no recent cuts or suspensions, underscoring consistency, especially important in volatile markets.
| Data Point | Value |
|---|---|
| Sector | Technology |
| Dividend Yield | 1.48% |
| Current Dividend Per Share | 0.995 USD |
| Dividend History | 26 years |
| Last Cut or Suspension | None |
📉 Dividend History
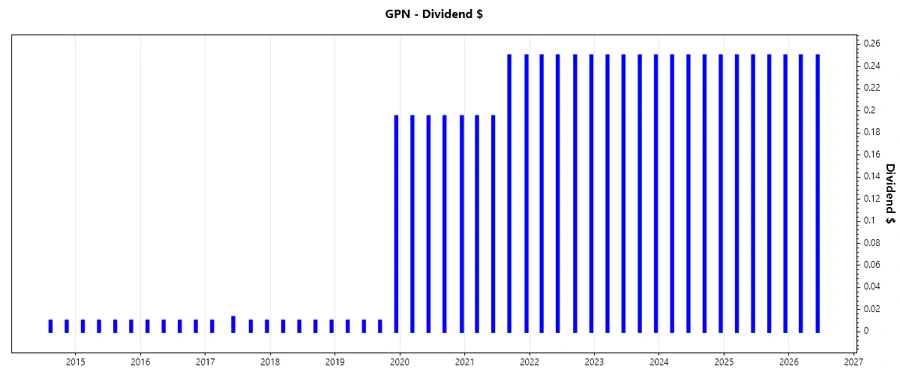
Consistency in dividend history signals GPN's commitment to returning value to investors. The company’s steady payout over the years suggests resilience and strategic stability. Despite periods of economic downturn, GPN has maintained its dividend payouts, making it attractive to income-focused investors.
| Year | Dividend Per Share (USD) |
|---|---|
| 2026 | 0.50 |
| 2025 | 1.00 |
| 2024 | 1.00 |
| 2023 | 1.00 |
| 2022 | 1.00 |
📈 Dividend Growth
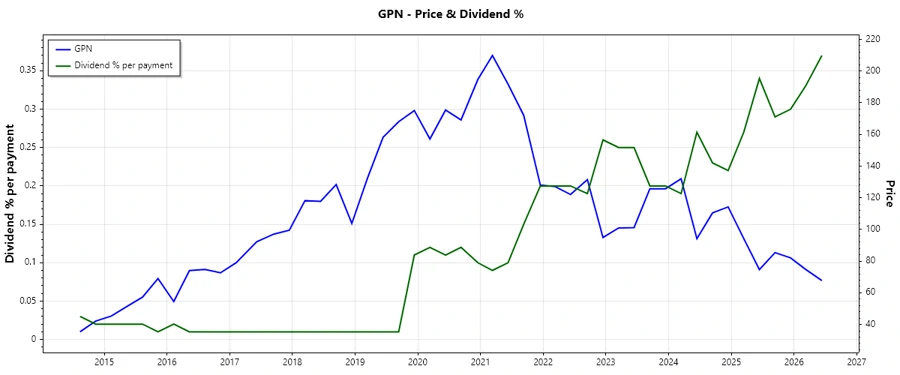
Dividend growth is a key indicator of a company's ability to enhance shareholder value over time. GPN has seen moderate growth in its dividend distribution, with a 5-year average growth rate of 5.09%. This reflects a cautious but steady uptrend in the dividend trajectory despite economic fluctuations.
| Time | Growth |
|---|---|
| 3 years | 0% |
| 5 years | 5.09% |
The average dividend growth is 5.09% over 5 years. This shows moderate but steady dividend growth.
✅ Payout Ratio
Evaluating the payout ratio provides insight into a company’s sustainability in covering dividends from earnings. At present, GPN indicates a concerning -33.81% EPS payout ratio, signifying unsustainable dividend payments in the current earnings scenario. However, the free cash flow payout ratio stands at a conservative 22.19%, which offers some confidence in cash-based sufficiency.
| Key figure ratio | |
|---|---|
| EPS-based | -33.81% |
| Free cash flow-based | 22.19% |
Given the negative EPS payout ratio, the reliability of dividend sustainability leans heavily on cash flow-derived metrics rather than net earnings. The 22.19% FCF payout suggests room to maintain dividends through robust cash operations.
💵 Cashflow & Capital Efficiency
Cash flow metrics are pivotal in assessing the ability to service dividends and other liabilities. GPN's free cash flow yield and strong cash flow conversion ratios reflect its capital generating capabilities, despite a high CAPEX to operating cash flow ratio of 41.46%.
| Category | 2025 | 2024 | 2023 |
|---|---|---|---|
| Free Cash Flow Yield | 10.99% | 10.03% | 4.80% |
| Earnings Yield | 7.54% | 5.51% | 2.97% |
| CAPEX to Operating Cash Flow | 23.25% | 19.10% | 29.27% |
| Stock-based Compensation to Revenue | 1.99% | 1.63% | 2.16% |
| Free Cash Flow / Operating Cash Flow Ratio | 76.75% | 80.90% | 70.73% |
| Return on Invested Capital | 2.50% | 4.58% | 4.17% |
Despite volatile earnings, the stable cash flow metrics highlight strategic operating efficiency, especially crucial given the past economic disruptions.
🏦 Balance Sheet & Leverage Analysis
A thorough assessment of leverage ratios reveals GPN's sound debt management policies. While the debt-to-equity ratio is moderately high at 95.28%, the company maintains a healthy quick ratio, showcasing short-term financial robustness.
| Category | 2025 | 2024 | 2023 |
|---|---|---|---|
| Debt-to-Equity | 95.28% | 75.47% | 75.55% |
| Debt-to-Assets | 40.88% | 35.86% | 34.36% |
| Debt-to-Capital | 48.79% | 43.01% | 43.04% |
| Net Debt to EBITDA | 3.91 | 3.16 | 4.09 |
| Current Ratio | 1.69 | 0.97 | 0.99 |
| Quick Ratio | 1.69 | 0.97 | 0.99 |
| Financial Leverage | 2.33 | 2.10 | 2.20 |
The company's leverage ratios depict a strategic balance between growth and financial stability, provided liquidity measures remain robust.
🧮 Fundamental Strength & Profitability
Fundamental profitability ratios are key indicators of operational efficiency. With marginal returns on equity and assets, especially recent negative returns, there’s a need to enhance profitability through strategic initiatives.
| Category | 2025 | 2024 | 2023 |
|---|---|---|---|
| Return on Equity | 6.12% | 7.05% | 4.29% |
| Return on Assets | 2.62% | 3.35% | 1.95% |
| Net Margin | 18.17% | 15.54% | 10.22% |
| EBIT Margin | 26.34% | 24.85% | 19.00% |
| EBITDA Margin | 44.71% | 44.72% | 38.72% |
| Gross Margin | 72.57% | 62.79% | 61.39% |
| Research & Development to Revenue | 0% | 0% | 0% |
Maintaining robust EBIT and EBITDA margins showcase cost efficiency, pivotal for GPN’s profitability improvement journey.
📉 Price Development
🔍 Dividend Scoring System
| Category | Score | Bar |
|---|---|---|
| Dividend Yield | 3 | |
| Dividend Stability | 4 | |
| Dividend Growth | 2 | |
| Payout Ratio | 3 | |
| Financial Stability | 3 | |
| Dividend Continuity | 5 | |
| Cashflow Coverage | 3 | |
| Balance Sheet Quality | 3 |
Total Score: 26/40
⭐ Rating
Global Payments Inc., with its consistent dividend record and moderate growth, shines in continuity and stability. However, improved operational performance and enhanced profitability measures are requisite for achieving robust dividend sustainability. Investors might find it a prudent holding in a diversified income-focused portfolio, but must vigilantly monitor earnings trends and leverage factors.
Smart Data Insight
Master the Perfect Entry & Exit for this Stock
Don't leave your profits to chance. Historically, this stock follows specific seasonal patterns that institutional traders use to maximize returns.
- ✅ Identify the "Golden Buying Window"
- ✅ Avoid high-risk correction cycles
- ✅ Backtested data from the last 20+ years