
June 09, 2026 a 07:46 am

GPN: Dividend Analysis - Global Payments Inc.
Global Payments Inc., a prominent player in the payment solutions industry, presents a stable dividend profile that captures investor interest. With a historical dividend growth record spanning over two decades, it conveys a reliable trajectory for income seekers. However, potential investors should balance the company's moderate yield against its payout ratios and earnings performance. This analysis delves into the nuances of Global Payments Inc.'s dividend metrics and financial health.
📊 Overview
Delving into Global Payments Inc.'s dividend metrics provides an illuminating perspective on its attractiveness for dividend investors. A sectoral analysis positions the company within the financial technology sphere, focusing on its dividend yield of 1.55%. This aligns moderately with industry expectations, but what stands out is the robust history of uninterrupted dividend payments over a span of 26 years, with no recent cuts or suspensions.
| Attribute | Details |
|---|---|
| Sector | Financial Technology |
| Dividend yield | 1.55 % |
| Current dividend per share | 0.99 USD |
| Dividend history | 26 years |
| Last cut or suspension | None |
🔍 Dividend History
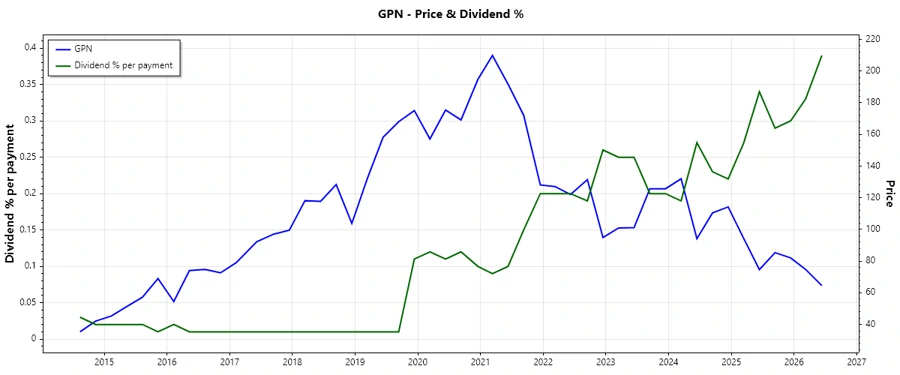
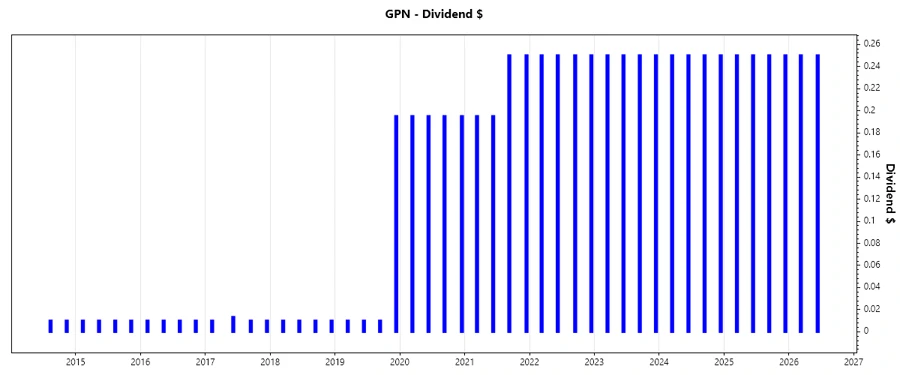
Examining the dividend history of Global Payments Inc. reveals consistent performances with meticulous attention to shareholder returns. The company's ability to maintain consistent payouts over substantial periods is a critical indicator of its financial resilience. The regularity in dividend payments serves as a solid foundation for income investors.
| Year | Dividend per Share (USD) |
|---|---|
| 2026 | 0.50 |
| 2025 | 1.00 |
| 2024 | 1.00 |
| 2023 | 1.00 |
| 2022 | 1.00 |
📈 Dividend Growth
The growth rate of dividends is a pivotal measure of a firm's expanding profitability and policy robustness. Global Payments Inc.'s trailing 3-year and 5-year growth rates depict incremental advances, which, albeit modest, represent an upward growth trajectory, indicative of the company's expanding capacity to enhance shareholder returns.
| Time | Growth |
|---|---|
| 3 years | 0 % |
| 5 years | 0.05 % |
The average dividend growth is 0.05% over 5 years. This shows moderate but steady dividend growth, suggesting cautious optimism about future payouts.
📉 Payout Ratio
The payout ratio reflects a company's dividend sustainability by comparing it to its net income and cash flow. Global Payments Inc.'s ratios, notably the EPS-based -33.81% and FCF-based 22.19%, offer a mixed perspective on its dividend coverage. The negative EPS payout ratio indicates reliance on other financial levers beyond earnings to sustain dividends, necessitating close scrutiny.
| Key figure | Ratio |
|---|---|
| EPS-based | -33.81 % |
| Free cash flow-based | 22.19 % |
💰 Cashflow & Capital Efficiency
Analyzing cash flow and capital efficiency indices provides insight into the financial operation's robustness. The metrics like Free Cash Flow Yield and CAPEX to Operating Cash Flow help gauge how effectively a company can cover its capital needs and maintain operational fluidity. Understanding these key figures helps investors evaluate the firm's capital stewardship.
| Year | 2025 | 2024 | 2023 |
|---|---|---|---|
| Free Cash Flow Yield | 10.99 % | 10.03 % | 4.80 % |
| Earnings Yield | 7.54 % | 5.51 % | 2.97 % |
| CAPEX to Operating Cash Flow | 23.25 % | 19.10 % | 29.27 % |
| Stock-based Compensation to Revenue | 1.99 % | 1.63 % | 2.16 % |
| Free Cash Flow / Operating Cash Flow Ratio | 76.75 % | 80.90 % | 70.73 % |
The cash flow stability and return on capital reflect Global Payments Inc.'s steady financial foundation and prudent capital management.
🏦 Balance Sheet & Leverage Analysis
The balance sheet and leverage ratios highlight a company's debt management and financial stability. Global Payments Inc.'s financial leverage and debt ratios illuminate its leverage scale and risk, with notable debt-to-equity metrics indicating managed financial structuring.
| Year | 2025 | 2024 | 2023 |
|---|---|---|---|
| Debt-to-Equity | 0.95 | 0.75 | 0.76 |
| Debt-to-Assets | 0.41 | 0.36 | 0.34 |
| Debt-to-Capital | 0.49 | 0.43 | 0.43 |
| Net Debt to EBITDA | 3.91 | 3.16 | 4.09 |
| Current Ratio | 1.69 | 0.97 | 0.99 |
| Quick Ratio | 1.69 | 0.97 | 0.99 |
| Financial Leverage | 2.33 | 2.10 | 2.20 |
These metrics indicate that while Global Payments Inc. maintains a conservative financial leverage approach, careful observation is advised to monitor potential shifts in their debt structure.
🔍 Fundamental Strength & Profitability
Evaluating the company's fundamental strengths and profitability underscores its financial health and operational efficiency. Metrics such as Return on Equity and asset margins provide essential perspectives on Global Payments Inc.'s value generation capabilities.
| Year | 2025 | 2024 | 2023 |
|---|---|---|---|
| Return on Equity (ROE) | 6.12 % | 7.05 % | 4.29 % |
| Return on Assets (ROA) | 2.62 % | 3.35 % | 1.95 % |
| Net Margin | 18.17 % | 15.54 % | 10.22 % |
| EBIT Margin | 26.34 % | 24.85 % | 19.00 % |
| EBITDA Margin | 44.71 % | 44.72 % | 38.72 % |
| Gross Margin | 72.57 % | 62.79 % | 61.39 % |
| Research & Development to Revenue | 0 % | 0 % | 0 % |
These metrics affirm Global Payments Inc. as it navigates competitive terrains, albeit with scope for improving operational margins.
💸 Price Development
🔢 Dividend Scoring System
| Criteria | Score | Indicator |
|---|---|---|
| Dividend yield | 3 | |
| Dividend Stability | 5 | |
| Dividend growth | 2 | |
| Payout ratio | 1 | |
| Financial stability | 4 | |
| Dividend continuity | 5 | |
| Cashflow Coverage | 3 | |
| Balance Sheet Quality | 4 |
Total Score: 27/40
🔚 Rating
In conclusion, Global Payments Inc. manifests a mildly attractive profile for dividend-focused investors. While its steady payment history and stable financial footing are commendable, enhancements in dividend growth and payout management could amplify its appeal. This analysis suggests a balanced stance for investors seeking income stability intertwined with potential growth.
Smart Data Insight
Master the Perfect Entry & Exit for this Stock
Don't leave your profits to chance. Historically, this stock follows specific seasonal patterns that institutional traders use to maximize returns.
- ✅ Identify the "Golden Buying Window"
- ✅ Avoid high-risk correction cycles
- ✅ Backtested data from the last 20+ years