May 09, 2026 a 03:31 pm


GPN: Dividend Analysis - Global Payments Inc.
Global Payments Inc. demonstrates moderate but consistent dividend performance, with a steady payout history over 26 years. Although the current dividend growth rate is low, the company's financial structure showcases stability in its sector. However, negative earnings ratios require attention for sustainable future payouts.
📊 Overview
Global Payments Inc. operates within a stable financial sector but presents unique challenges and opportunities. Below is a concise look at its current dividend metrics:
| Key Metric | Value |
|---|---|
| Sector | Financial Data Services |
| Dividend yield | 1.45 % |
| Current dividend per share | 0.99 USD |
| Dividend history | 26 years |
| Last cut or suspension | None |
💼 Dividend History
With over two decades of uninterrupted dividend payments, the company's capacity for stability in shareholder returns is evident. Consistency is a critical factor in building investor trust and sustaining market value.
| Year | Dividend per Share (USD) |
|---|---|
| 2026 | 0.50 |
| 2025 | 1.00 |
| 2024 | 1.00 |
| 2023 | 1.00 |
| 2022 | 1.00 |
📈 Dividend Growth
While the 3-year dividend growth is stagnant, the 5-year perspective indicates potential for gradual improvement, essential for long-term investor gains.
| Time | Growth |
|---|---|
| 3 years | 0 % |
| 5 years | 5.09 % |
The average dividend growth is 5.09 % over 5 years. This shows moderate but steady dividend growth.
⏳ Payout Ratio
The payout ratio reveals the proportion of earnings a company pays to its shareholders in dividends, reflecting payout sustainability.
| Key figure | Ratio |
|---|---|
| EPS-based | -33.81 % |
| Free cash flow-based | 22.19 % |
The notable negative EPS payout ratio suggests earnings are not currently sufficient to cover dividend payments, posing a potential risk without improved profitability. However, the positive FCF payout ratio indicates dividends are financially manageable through cash flow.
💰 Cashflow & Capital Efficiency
Evaluating cash flow efficiency helps assess how well the company turns revenues into cash and how prudently it deploys capital for growth.
| Year | 2023 | 2024 | 2025 |
|---|---|---|---|
| Free Cash Flow Yield | 4.80 % | 10.03 % | 10.99 % |
| Earnings Yield | 2.97 % | 5.51 % | 7.54 % |
| CAPEX to Operating Cash Flow | 29.27 % | 19.10 % | 23.25 % |
| Stock-based Compensation to Revenue | 2.16 % | 1.63 % | 1.99 % |
| Free Cash Flow / Operating Cash Flow Ratio | 70.73 % | 80.90 % | 76.75 % |
With robust free cash flow yields and strategic capital expenditure management, Global Payments Inc. showcases effective cash flow utilization. The stability in capital efficiency underscores potential for sustained investments and growth.
💳 Balance Sheet & Leverage Analysis
A sturdy balance sheet reflects the company's ability to withstand economic downturns and leverage opportunities with poise.
| Year | 2023 | 2024 | 2025 |
|---|---|---|---|
| Debt-to-Equity | 75.55 % | 75.47 % | 95.28 % |
| Debt-to-Assets | 34.36 % | 35.86 % | 40.88 % |
| Debt-to-Capital | 43.04 % | 43.01 % | 48.79 % |
| Net Debt to EBITDA | 4.09 | 3.16 | 3.91 |
| Current Ratio | 0.99 | 0.97 | 1.69 |
| Quick Ratio | 0.99 | 0.97 | 1.69 |
| Financial Leverage | 2.20 | 2.10 | 2.33 |
The relatively high leverage ratios necessitate careful monitoring of debt levels. High debt-to-equity and steady quick ratios suggest potential solvency risks, balanced partially by improved quick ratio figures in the latest year.
📈 Fundamental Strength & Profitability
Profitability measures reveal operational efficiency, crucial for value creation and competitive standing.
| Year | 2023 | 2024 | 2025 |
|---|---|---|---|
| Return on Equity | 4.29 % | 7.05 % | 6.12 % |
| Return on Assets | 1.95 % | 3.35 % | 2.62 % |
| Margins: Net | 10.22 % | 15.54 % | 18.17 % |
| Margins: EBIT | 19.00 % | 24.85 % | 26.34 % |
| Margins: EBITDA | 38.72 % | 44.72 % | 44.71 % |
| Margins: Gross | 61.39 % | 62.79 % | 72.57 % |
| Research & Development to Revenue | 0% | 0% | 0% |
With solid gross margins and improving net margins, Global Payments Inc. maintains profitability. Lack of R&D investments could restrict innovation-driven growth.
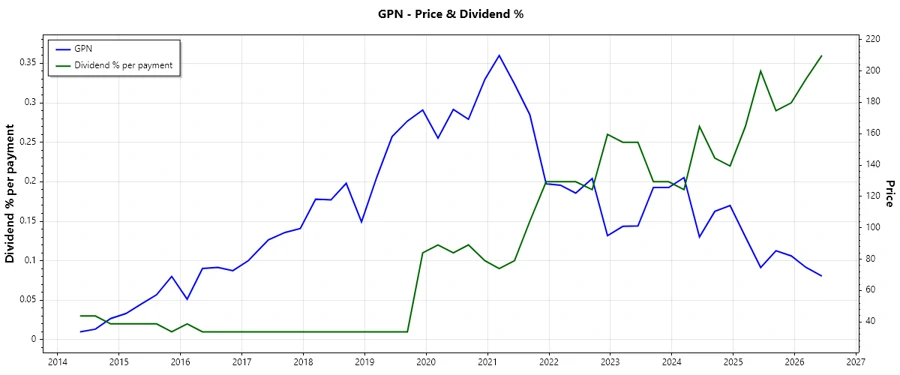
⚙️ Price Development
✅ Dividend Scoring System
| Category | Score | Score Bar |
|---|---|---|
| Dividend yield | 3 | |
| Dividend Stability | 4 | |
| Dividend growth | 2 | |
| Payout ratio | 2 | |
| Financial stability | 3 | |
| Dividend continuity | 5 | |
| Cashflow Coverage | 3 | |
| Balance Sheet Quality | 3 |
Total Score: 25/40
🗣️ Rating
Global Payments Inc. presents moderate dividend returns with a stable history but lacks significant growth momentum. Investment considerations should balance the company's consistent payout history with its current financial leverage and limited earnings coverage.
Smart Data Insight
Master the Perfect Entry & Exit for this Stock
Don't leave your profits to chance. Historically, this stock follows specific seasonal patterns that institutional traders use to maximize returns.
- ✅ Identify the "Golden Buying Window"
- ✅ Avoid high-risk correction cycles
- ✅ Backtested data from the last 20+ years