February 25, 2026 a 12:46 pm


GPN: Dividend Analysis - Global Payments Inc.
Global Payments Inc. presents a moderate dividend yield with a longstanding history of consistent payouts over 26 years. Despite recent slow growth in dividends, the company’s robust payout ratios indicate a sustainable practice. The firm's financial structure exhibits significant stability, promising positive returns for dividend-focused investors.
📊 Overview
Global Payments Inc. operates in the Technology sector, providing a dividend yield at 1.28%, with a historical consistency in dividend payments across 26 years. The current dividend per share stands at 0.99 USD, with no recent cuts or suspensions, demonstrating reliability in shareholder returns.
| Metric | Value |
|---|---|
| Sector | Technology |
| Dividend yield | 1.28% |
| Current dividend per share | 0.99 USD |
| Dividend history | 26 years |
| Last cut or suspension | None |
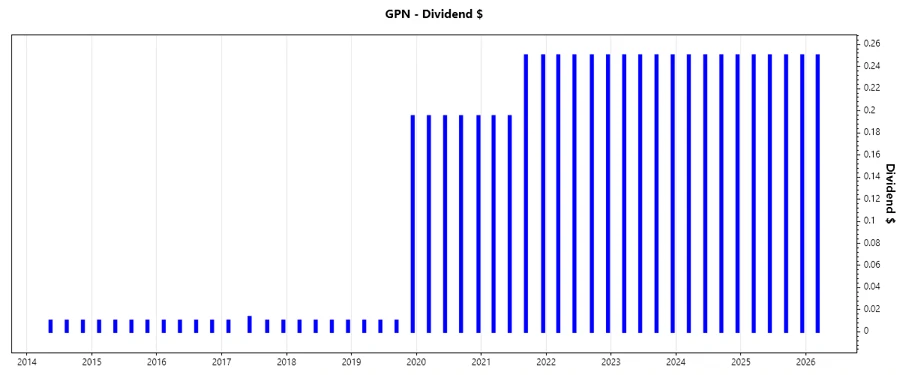
📈 Dividend History
The dividend history reflects consistent payments, crucial for assessing the reliability of capital returns to shareholders. Long-term stability in these payments is a positive indicator of the company's commitment to returning value to shareholders.
| Year | Dividend per Share (USD) |
|---|---|
| 2026 | 0.25 |
| 2025 | 1.00 |
| 2024 | 1.00 |
| 2023 | 1.00 |
| 2022 | 1.00 |
📈 Dividend Growth
Dividend growth, though minimal over the last three years, stands at a modest 5.09% over five years. This gradual increase signals a steady, albeit slow, enhancement in shareholder returns.
| Time | Growth |
|---|---|
| 3 years | 0% |
| 5 years | 5.09% |
The average dividend growth is 5.09% over 5 years. This shows moderate but steady dividend growth.
⚠️ Payout Ratio
Payout ratios are pivotal in understanding the sustainability of dividend payments. GPN's EPS-based ratio at 17.04% and FCF-based at 11.55% indicate a conservative strategy, ensuring ample reinvestment capacity while maintaining shareholder disbursements.
| Key figure | Ratio |
|---|---|
| EPS-based | 17.04% |
| Free cash flow-based | 11.55% |
These ratios demonstrate a disciplined payout approach, preserving a balance between rewarding shareholders and securing financial flexibility.
Cashflow & Capital Efficiency
A thorough review of cash flow indicators aids in analyzing the company's liquidity position and efficiency in capital allocation. These metrics underline the operational proficiency and resourcefulness of Global Payments Inc.
| Metric | 2023 | 2024 | 2025 |
|---|---|---|---|
| Free Cash Flow Yield | 4.80% | 10.03% | 10.99% |
| Earnings Yield | 2.97% | 5.51% | 7.54% |
| CAPEX to Operating Cash Flow | 29.27% | 19.10% | 23.25% |
| Stock-based Compensation to Revenue | 2.16% | 1.63% | 1.99% |
| Free Cash Flow / Operating Cash Flow Ratio | 70.73% | 80.90% | 76.75% |
The varying yields and ratios reflect a strategic balancing act, maximizing available cash and optimizing capital efficiency amidst market fluctuations.
Balance Sheet & Leverage Analysis
Understanding the balance sheet dynamics and leverage is crucial for evaluating the company's stability and risk factors associated with its debt levels and liquidity capabilities.
| Metric | 2023 | 2024 | 2025 |
|---|---|---|---|
| Debt-to-Equity | 0.75 | 0.75 | 0.95 |
| Debt-to-Assets | 0.34 | 0.36 | 0.41 |
| Debt-to-Capital | 0.43 | 0.43 | 0.49 |
| Net Debt to EBITDA | 4.09 | 3.16 | 4.23 |
| Current Ratio | 0.99 | 0.97 | 1.69 |
| Quick Ratio | 0.99 | 0.97 | 1.69 |
| Financial Leverage | 2.20 | 2.10 | 2.33 |
The debt metrics display controlled leverage and a fortified liquidity position, effective in managing credit exposure and ensuring operational stability.
Fundamental Strength & Profitability
Assessing profitability through core metric evaluations provides a lucid picture of the company's efficiency and sustainability in maintaining its financial health over time.
| Metric | 2023 | 2024 | 2025 |
|---|---|---|---|
| Return on Equity | 4.29% | 7.05% | 6.12% |
| Return on Assets | 1.95% | 3.35% | 2.62% |
| Margins: Net | 10.22% | 15.54% | 18.17% |
| Margins: EBIT | 19.00% | 24.85% | 19.10% |
| Margins: EBITDA | 38.72% | 44.72% | 37.47% |
| Margins: Gross | 61.39% | 62.79% | 72.57% |
| Research & Development to Revenue | 0% | 0% | 0% |
With stable ROE and margins, Global Payments Inc. demonstrates proficient operations, conducive for sustained growth and investor confidence.
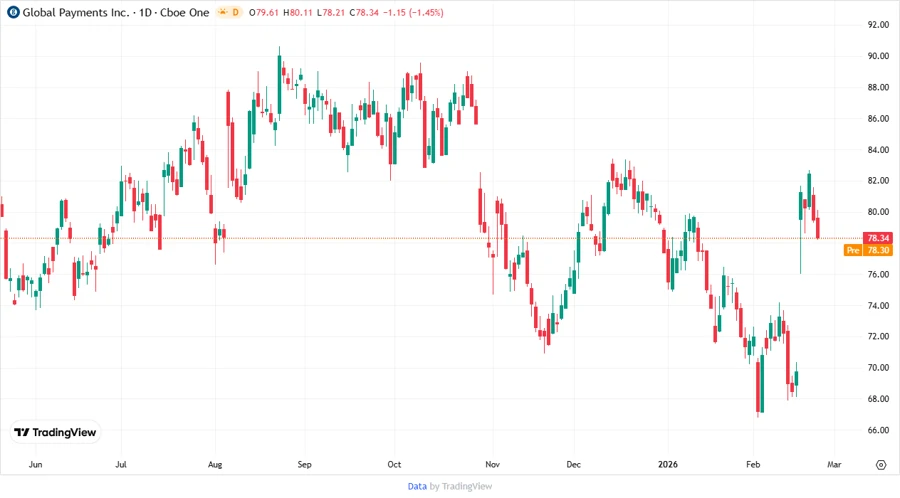
Price Development
📊 Dividend Scoring System
| Criteria | Score | Score Bar |
|---|---|---|
| Dividend yield | 3 | |
| Dividend Stability | 4 | |
| Dividend growth | 2 | |
| Payout ratio | 5 | |
| Financial stability | 4 | |
| Dividend continuity | 5 | |
| Cashflow Coverage | 3 | |
| Balance Sheet Quality | 4 |
Total Score: 30/40
✅ Rating
Global Payments Inc. is considered a reliable choice for dividend investors seeking steady income with substantial financial security backing. Its prudent payout ratios, consistent history, and strategic cash flow management reflect a solid dividend policy. The company's overall financial health suggests it will continue to provide consistent returns while cautiously navigating market opportunities.