February 05, 2026 a 03:31 am

GPN: Dividend Analysis - Global Payments Inc.
Global Payments Inc. presents a compelling dividend profile for investors seeking a balance between stability and moderate growth. Despite challenges, the company has maintained a steady dividend yield, reflecting its commitment to shareholder value. The combination of robust financial metrics and a strategic focus on long-term growth signals promising prospects for future dividend continuity.
Overview
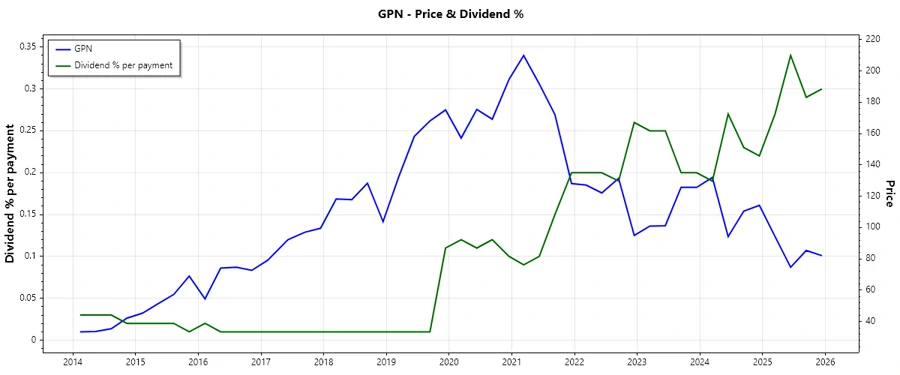
Global Payments Inc., operating in the Technology sector, showcases a modest yet stable dividend yield, offering a predictable income stream for investors. With a dividend yield of 1.22% and a current dividend per share of 0.99 USD, the company has demonstrated an impressive 25 years of dividend-payer status with the last cut occurring in 2018. This track record underlines its dedication to providing consistent shareholder returns.
| Metric | Details |
|---|---|
| Sector | Technology |
| Dividend yield | 1.22 % |
| Current dividend per share | 0.994 USD |
| Dividend history | 25 years |
| Last cut or suspension | 2018 |
Dividend History
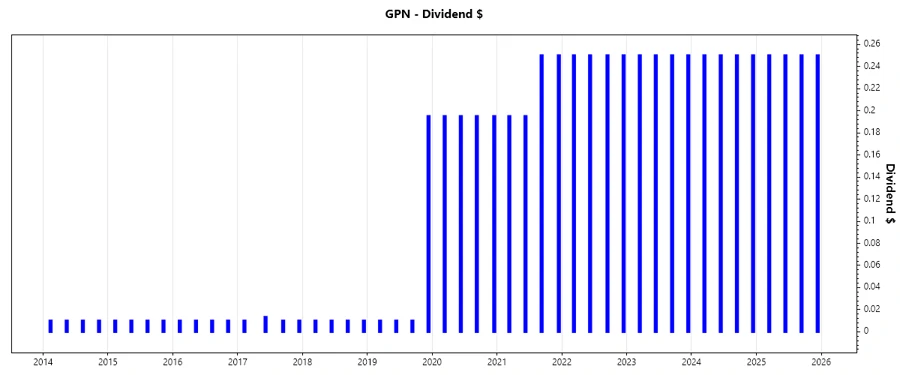
The stable dividend history of Global Payments Inc. reflects its strong financial positioning and consistent operational performance. An uninterrupted dividend payment for 25 consecutive years highlights the company's reliability and commitment to returning value to shareholders. This historical consistency is integral for those seeking a steady income stream and provides confidence in the firm's enduring financial health.
| Year | Dividend per Share (USD) |
|---|---|
| 2025 | 1.00 |
| 2024 | 1.00 |
| 2023 | 1.00 |
| 2022 | 1.00 |
| 2021 | 0.89 |
Dividend Growth
While the recent 3-year growth has been flat, the five-year dividend growth rate of 5.1% suggests a cautious but deliberate strategy towards incrementally enhancing shareholder returns. This moderate growth is indicative of the company's adaptive strategy to balance immediate payout with long-term financial health.
| Time | Growth |
|---|---|
| 3 years | 0% |
| 5 years | 5.10% |
The average dividend growth is 5.1% over 5 years. This shows moderate but steady dividend growth.
Payout Ratio
Payout ratios offer insights into financial sustainability. A lower EPS-based payout ratio of 13.62% and an FCF-based ratio of 10.89% indicate that the dividends are well-covered, ensuring the firm's ability to continue these distributions without jeopardizing its financial position. These figures suggest a prudent approach to balancing investor distribution with the company's growth and reinvestment needs.
| Key figure | Ratio |
|---|---|
| EPS-based | 13.62 % |
| Free cash flow-based | 10.89 % |
These figures demonstrate a conservative payout strategy, enabling a stable financial footing while compensating investors.
Cashflow & Capital Efficiency
Global Payments Inc.'s cash flow analysis highlights its operational efficiency and capital management prowess. The Free Cash Flow Yield and Earnings Yield reflect the company's capacity to generate cash relative to its market value and earnings. The CAPEX to Operating Cash Flow ratio indicates a disciplined investment in growth opportunities, supporting future expansion. Stock-based compensation remains modest relative to revenue, ensuring shareholder value isn't unduly diluted.
| Metric | 2024 | 2023 | 2022 |
|---|---|---|---|
| Free Cash Flow Yield | 10.03% | 4.80% | 5.96% |
| Earnings Yield | 5.51% | 2.97% | 4.08% |
| CAPEX to Operating Cash Flow | 19.10% | 29.27% | 27.43% |
| Stock-based Compensation to Revenue | 1.62% | 2.16% | 1.82% |
| Free Cash Flow / Operating Cash Flow Ratio | 80.90% | 70.73% | 72.57% |
The figures indicate solid cash generation coupled with disciplined capital allocation, emphasizing the company's capability to sustain operations and shareholder returns.
Balance Sheet & Leverage Analysis
Assessing Global Payments Inc.'s balance sheet reveals a robust financial structure enhanced by moderate leverage. Debt-to-equity metrics are well within manageable ranges, underscoring the financial discipline in managing liabilities. The company's ability to cover interest with earnings reinforced by its solvency ratios showcases a resilient financial foundation capable of withstanding economic fluctuations.
| Metric | 2024 | 2023 | 2022 |
|---|---|---|---|
| Debt-to-Equity | 0.755 | 0.755 | 0.641 |
| Debt-to-Assets | 0.359 | 0.344 | 0.319 |
| Debt-to-Capital | 0.430 | 0.430 | 0.390 |
| Net Debt to EBITDA | 3.16 | 4.09 | 5.06 |
| Current Ratio | 0.965 | 0.994 | 0.915 |
| Quick Ratio | 0.965 | 0.994 | 0.915 |
| Financial Leverage | 2.105 | 2.199 | 2.009 |
These indicators reflect prudent leverage management, ensuring flexibility in financing future growth opportunities while maintaining the capacity to meet current liabilities.
Fundamental Strength & Profitability
Global Payments Inc.'s fundamental metrics demonstrate solid profitability ratios and efficient asset utilization. ROE and ROA, along with various margin analyses, depict a healthy core operational competence. Though modest, ongoing profitability enhancements illustrate potential areas for future strategic implementations, adding value to long-term shareholder ambitions.
| Metric | 2024 | 2023 | 2022 |
|---|---|---|---|
| Return on Equity | 7.05% | 4.29% | 0.50% |
| Return on Assets | 3.35% | 1.95% | 0.25% |
| Net Margin | 15.54% | 10.22% | 1.24% |
| EBIT Margin | 24.85% | 19.00% | 7.27% |
| EBITDA Margin | 44.72% | 38.72% | 27.05% |
These financial indicators portray Global Payments Inc.'s compelling ability to maximize shareholder value through proficient financial management and consistent profitability.
Dividend Scoring System
| Criteria | Score | Score Bar |
|---|---|---|
| Dividend yield | 3 | |
| Dividend Stability | 5 | |
| Dividend growth | 2 | |
| Payout ratio | 5 | |
| Financial stability | 4 | |
| Dividend continuity | 5 | |
| Cashflow Coverage | 4 | |
| Balance Sheet Quality | 4 |
Overall Score: 32 out of 40
Rating
Global Payments Inc. demonstrates robust dividend dynamics with high stability and continuity scores; however, slight reservations remain regarding growth performance. With strategic improvements anticipated, this stock offers a solid holding for conservative investors prioritizing long-term value retention over rapid capital appreciation. A "Hold" recommendation is appropriate as the company balances moderate yields with substantial operational groundwork for future expansion.