October 06, 2025 a 03:32 am

📊 GPN: Dividend Analysis - Global Payments Inc.
The current dividend profile of Global Payments Inc. presents a moderate prospective yield with a robust history of stability. In recent years, while there has been steady growth, the current payout ratios suggest that the company has plenty of room to enhance its dividends. With a consistent dividend history spanning 25 years, this commitment underscores its reliability and appeal to dividend-focused investors.
🗣️ Overview
Global Payments Inc. (Sector: Information Technology) offers a dividend yield of 1.17%. With a current dividend per share of 0.99 USD and a 25-year dividend history, the company's last cut or suspension is notably non-existent, reflecting its consistent dividend payment strategy.
| Metric | Details |
|---|---|
| Sector | Information Technology |
| Dividend yield | 1.17% |
| Current dividend per share | 0.99 USD |
| Dividend history | 25 years |
| Last cut or suspension | None |
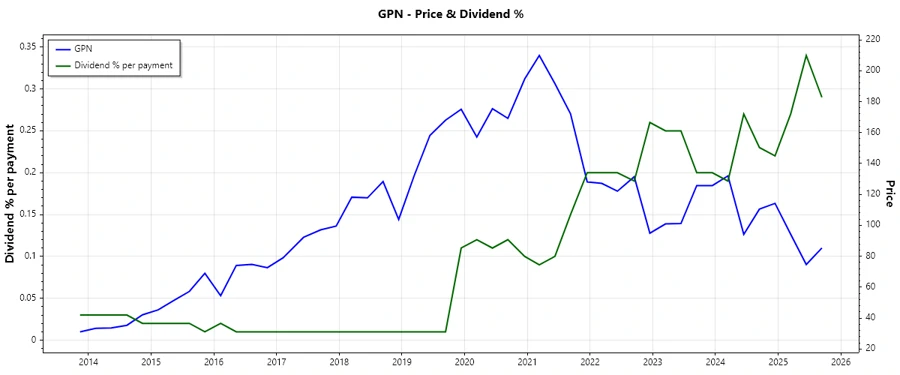
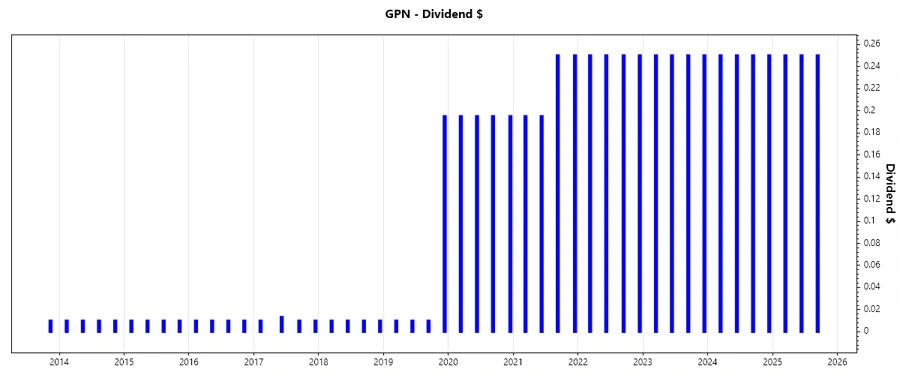
📈 Dividend History
A steadfast dividend history is pivotal for investors seeking consistent income. With 25 years of uninterrupted payments, Global Payments Inc. demonstrates a strong commitment to rewarding its shareholders. This historical reliability acts as a cornerstone of its appeal when assessing long-term investments.
| Year | Dividend Per Share (USD) |
|---|---|
| 2025 | 0.75 |
| 2024 | 1.00 |
| 2023 | 1.00 |
| 2022 | 1.00 |
| 2021 | 0.89 |
📈 Dividend Growth
The analysis of dividend growth is essential for evaluating a company's future dividend potential and income growth for investors. Over the last 3 and 5 years, the dividends have shown moderate growth, underlining the company's ability to enhance shareholder returns.
| Time | Growth |
|---|---|
| 3 years | 3.96% |
| 5 years | 34.76% |
The average dividend growth is 34.76% over 5 years. This shows moderate but steady dividend growth, indicating the company's strength in generating shareholder value.
✅ Payout Ratio
The payout ratio provides insight into how sustainably a company can maintain or grow its dividends based on its earnings or free cash flow. Global Payments Inc. exhibits prudent payout ratios, allowing room for potential dividend increases.
| Key figure | Ratio |
|---|---|
| EPS-based | 16.94% |
| Free cash flow-based | 8.19% |
The EPS-based payout ratio of 16.94% and the FCF-based ratio of 8.19% indicate significant flexibility to boost dividends, supported by solid earnings and cash flow coverage.
🔎 Cashflow & Capital Efficiency
An analysis of cash flow and capital efficiency is vital for understanding a company's capability to generate cash relative to its financial commitments and capital use.
| Year | 2024 | 2023 | 2022 |
|---|---|---|---|
| Free Cash Flow Yield | 10.01% | 4.80% | 5.96% |
| Earnings Yield | 5.50% | 2.97% | 0.41% |
| CAPEX to Operating Cash Flow | 19.10% | 29.27% | 27.43% |
| Stock-based Compensation to Revenue | 1.63% | 2.16% | 1.82% |
| Free Cash Flow / Operating Cash Flow Ratio | 81% | 71% | 73% |
With sustained free cash flow yields and efficient CAPEX allocation, Global Payments Inc. reflects stable cash flow efficiency and robust capital deployment practices.
⚖️ Balance Sheet & Leverage Analysis
A thorough leverage and liquidity assessment is crucial to evaluate the financial health and risk associated with a company's debt strategy.
| Year | 2024 | 2023 | 2022 |
|---|---|---|---|
| Debt-to-Equity | 0.755 | 0.755 | 0.641 |
| Debt-to-Assets | 0.359 | 0.344 | 0.319 |
| Debt-to-Capital | 0.430 | 0.430 | 0.390 |
| Net Debt to EBITDA | 3.27 | 4.24 | 5.26 |
| Current Ratio | 0.965 | 0.994 | 0.915 |
| Quick Ratio | 0.965 | 0.994 | 0.915 |
| Financial Leverage | 2.10 | 2.20 | 2.01 |
Global Payments Inc.'s leverage ratios are stable, showing its ability to manage debts efficiently without compromising liquidity positions.
🏆 Fundamental Strength & Profitability
Assessing fundamental strength and profitability is essential to understanding a company's ability to generate value and sustainable returns for shareholders.
| Year | 2024 | 2023 | 2022 |
|---|---|---|---|
| Return on Equity | 7.05% | 4.29% | 0.50% |
| Return on Assets | 3.35% | 1.95% | 0.25% |
| Return on Invested Capital | 4.65% | 3.19% | 0.41% |
| Margins: Net | 15.54% | 10.22% | 1.24% |
| Margins: EBIT | 24.77% | 18.96% | 7.51% |
| Margins: EBITDA | 43.19% | 37.36% | 26.03% |
| Margins: Gross | 62.79% | 61.39% | 57.90% |
| R&D to Revenue | 0.00% | 0.00% | 0.00% |
The company's profitability metrics indicate satisfactory performance, with robust margins and positive returns on equity, assets, and invested capital.
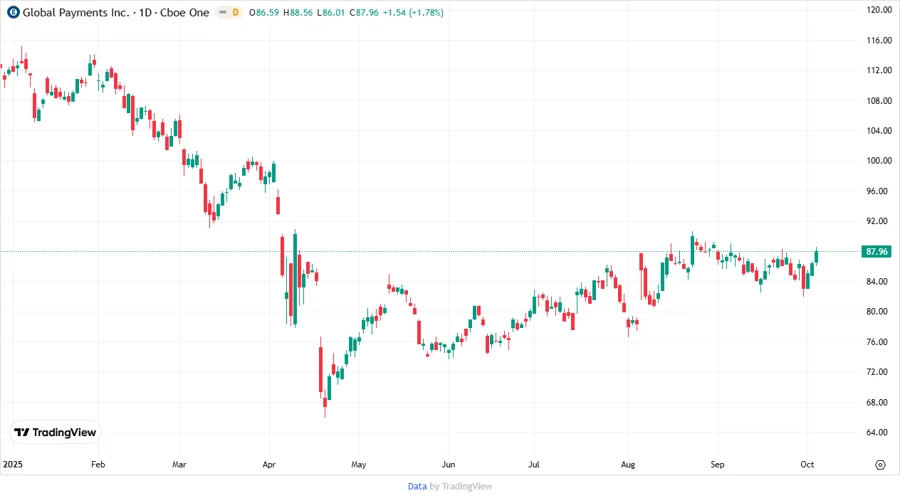
💹 Price Development
⭐ Dividend Scoring System
| Criteria | Description | Score |
|---|---|---|
| Dividend yield | Yield attractiveness | |
| Dividend Stability | Consistency in dividend payments | |
| Dividend growth | Rate of dividend increase | |
| Payout ratio | Sustainability of dividends | |
| Financial stability | Debt management and leverage | |
| Dividend continuity | Uninterrupted payment track record | |
| Cashflow Coverage | Ability to fund dividends with cash flow | |
| Balance Sheet Quality | Strength of financial statements |
Total Score: 34 out of 40
🔍 Rating
In conclusion, Global Payments Inc. demonstrates solid dividend appeal underpinned by its longstanding dividend stability, reasonable growth potential, and strong payout ratios. While the yield itself remains moderate, the company's broader financial health and disciplined capital management foster a commendable backdrop for dividend sustainability. An investment in Global Payments Inc. represents a prudent choice for income-focused investors seeking reliability and consistent growth prospects.
Smart Data Insight
Master the Perfect Entry & Exit for this Stock
Don't leave your profits to chance. Historically, this stock follows specific seasonal patterns that institutional traders use to maximize returns.
- ✅ Identify the "Golden Buying Window"
- ✅ Avoid high-risk correction cycles
- ✅ Backtested data from the last 20+ years